
Weekly Observations
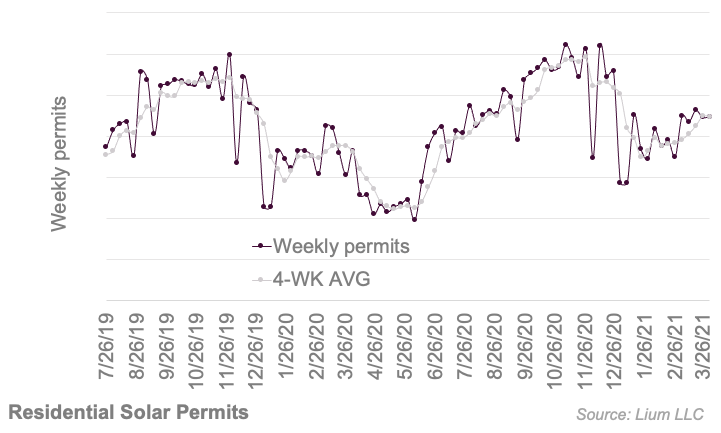
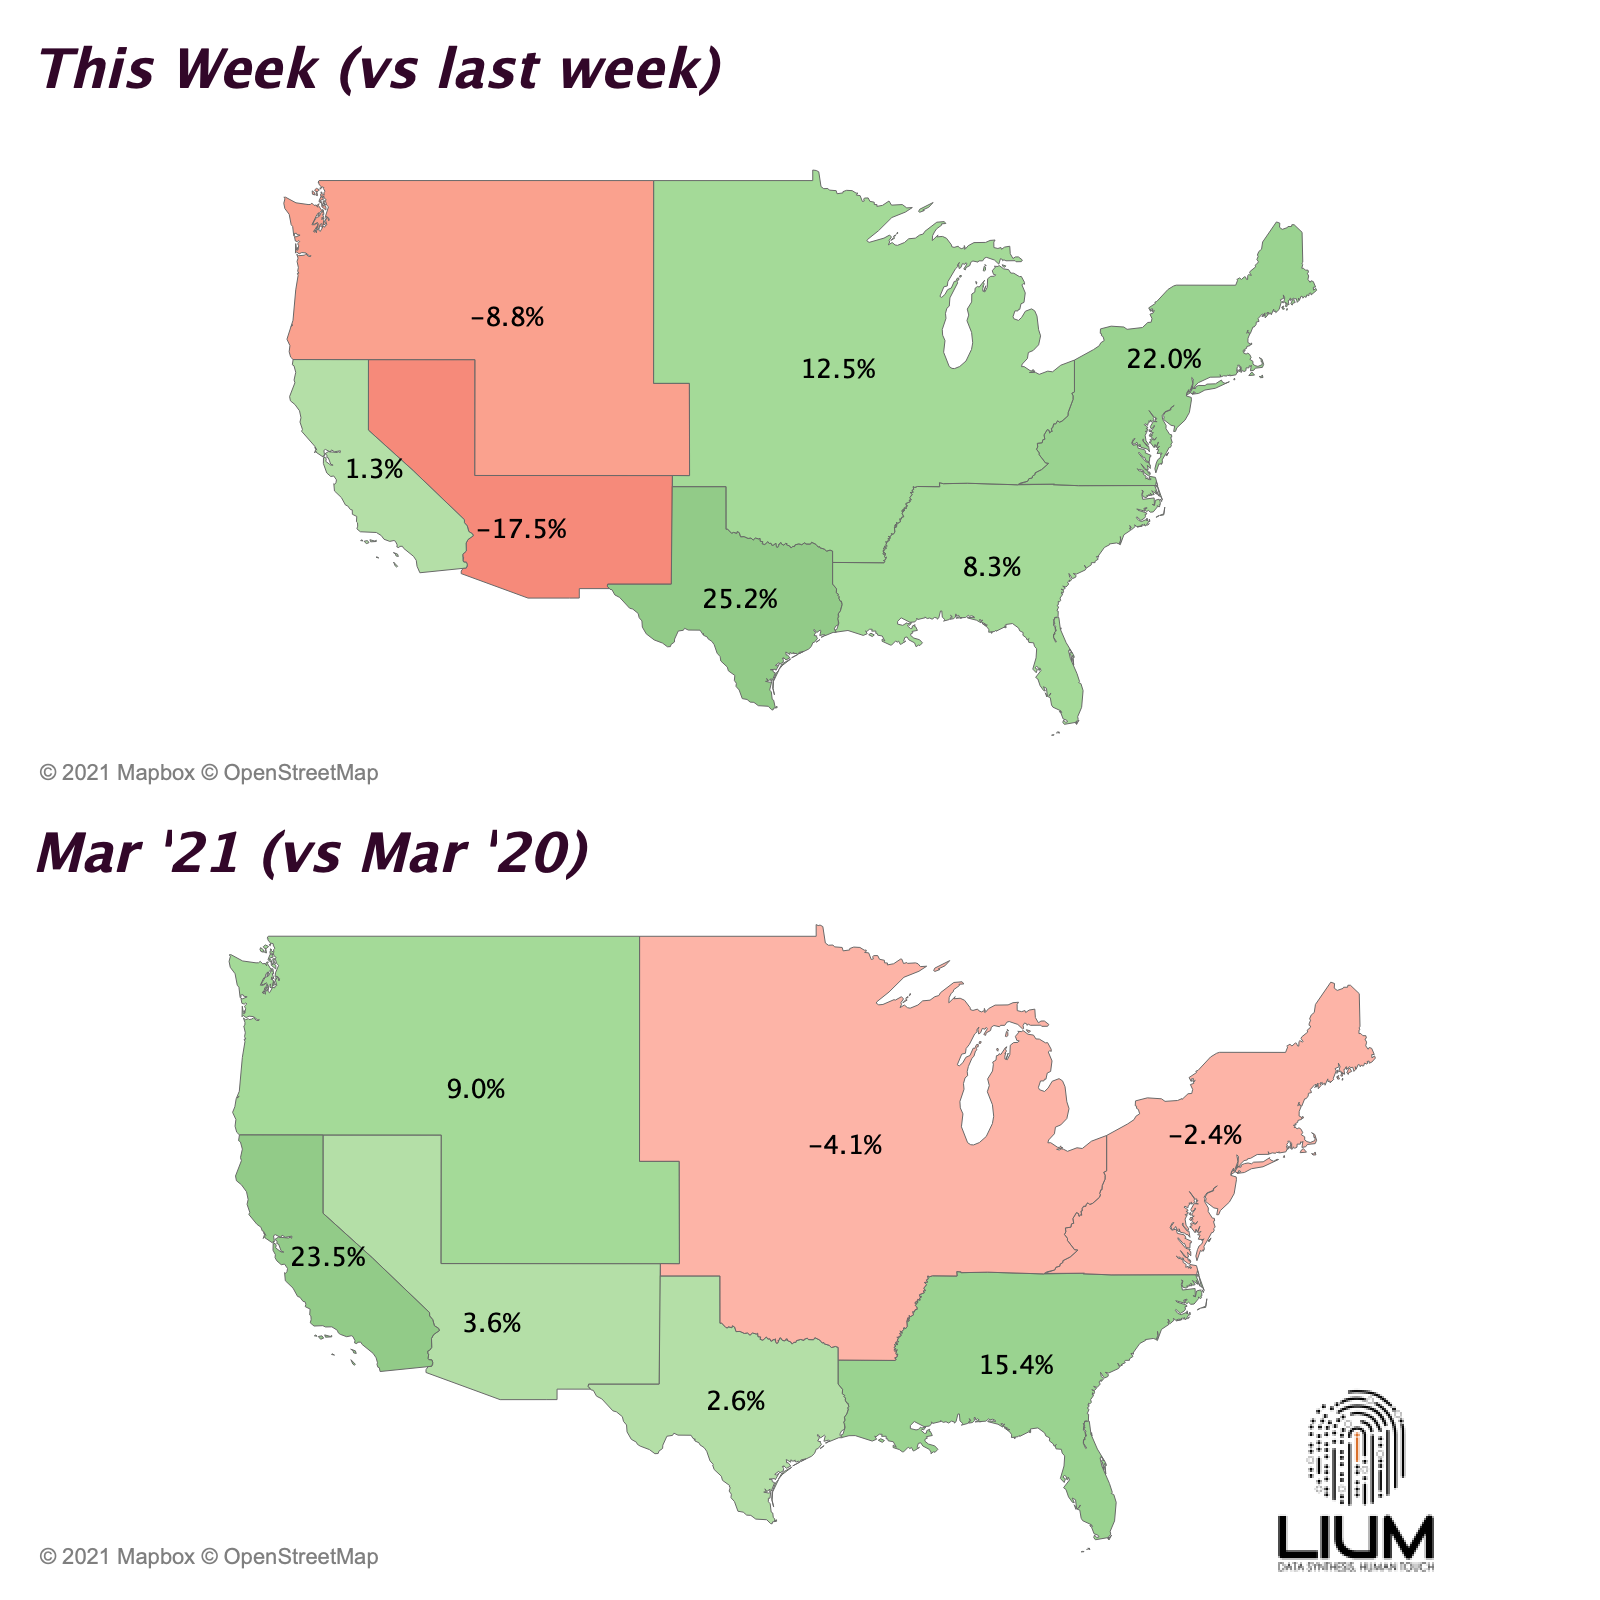
- This Week. For the fourth straight week, permit activity was flat throughout the country. Our strongest regions were the East +22% and Texas +25%. Compared to the same week one year ago, permits are tracking up +30%, however it is important to note that many cities were facing covid restrictions, resulting in decreased permit activity.
- March. For March, permits are tracking up 27% from year ago levels.
- Q1’21 / Q2’21E. Compared to a year ago, permits are tracking up 13% for Q1. Looking ahead, Q2 is on track to be up 40-50%, due to abnormally low (covid driven) permits last year. In a scenario that April / May / June permits don’t begin growing by 10% per month, year over year comps would quickly turn ugly as the current run rate is still 5% BELOW the Q3’20 average and 20% BELOW the peak in October 2020.
- Texas. Texas had the strongest W/W performance of our solar regions, led by El Paso and Fort Worth which each had their second highest week of permit activity in 2021. For Q1’21, Texas permits are tracking up 3% compared to last year and down -14% sequentially (outperforming US average down -20% – seasonally low permit quarter).
Join Lium For Free And Get Industry Situation Briefs Like This Sent To Your Inbox… Or Check Out Our Premium Membership Plans Here To Explore The Underlying Data, Predictive Models, In-Depth Reports & More…