
August still trending lower
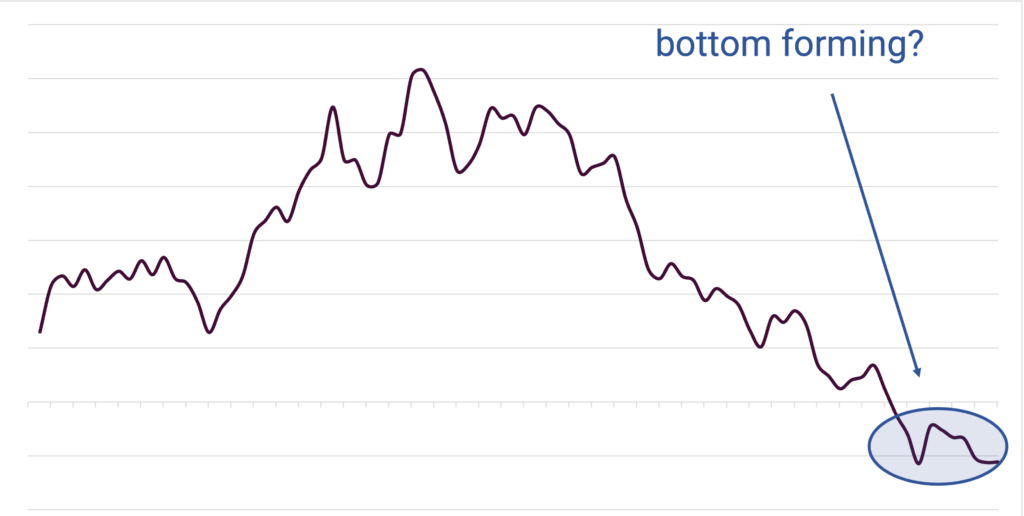
For August, residential solar permits are landing down 18% y/y.
First look at California interconnection applications (Q2 finally released this week)
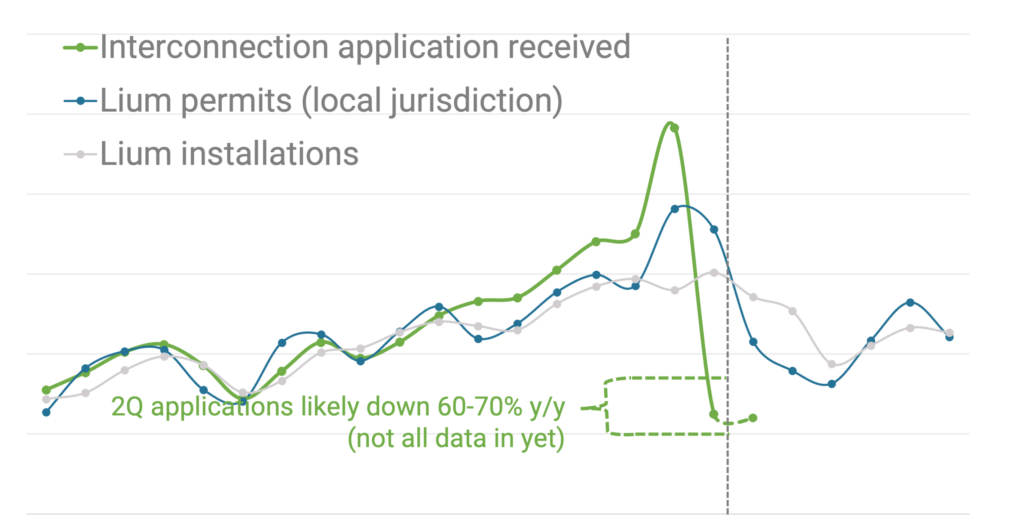
California interconnection application data was finally released following the NEM 3.0 switch, confirming a >60% y/y drop in applications in Q2.
SOLARSAT™: July hitting on all cylinders
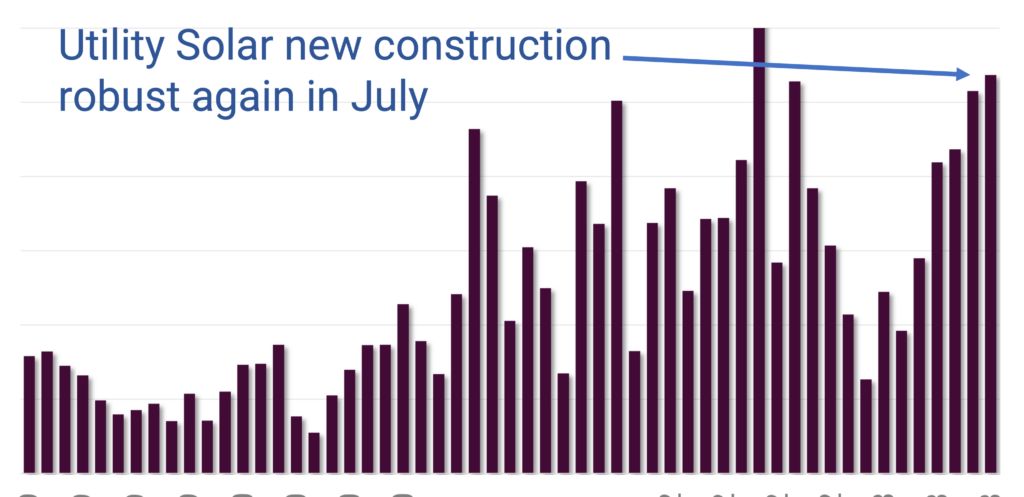
Broadly speaking, activity across the board was robust in July, particularly for new construction which was almost double last year.
July not bouncing back; Estimates still too high
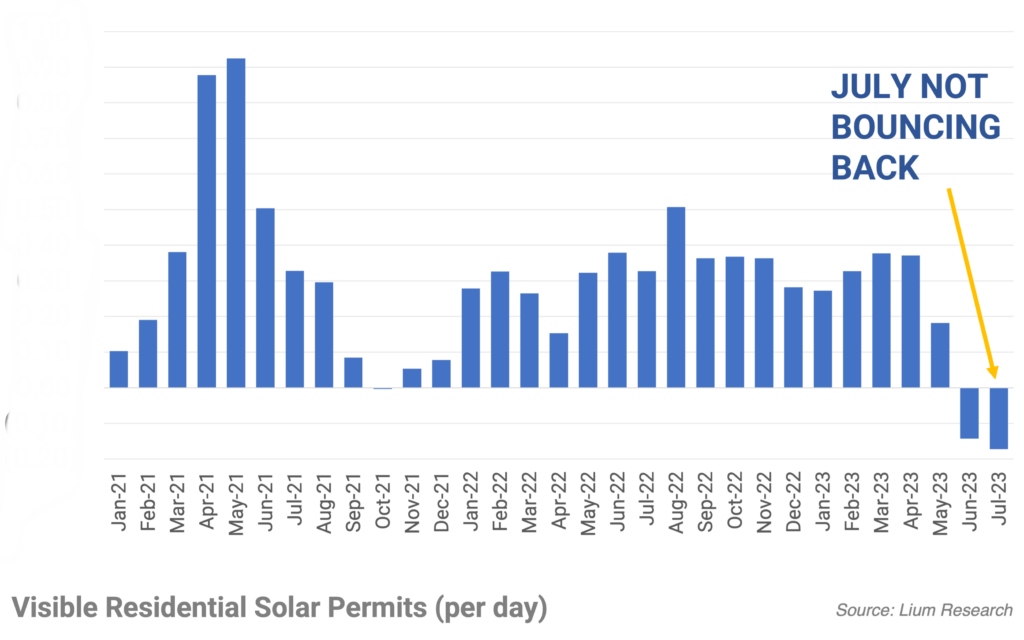
Last weeks permit activity was another disappointing datapoint, with residential solar permits down 18% y/y.
July slide deck takeaways

Panel supply flows are great compared to 2022
Terrible June followed by even slower July 4 last week
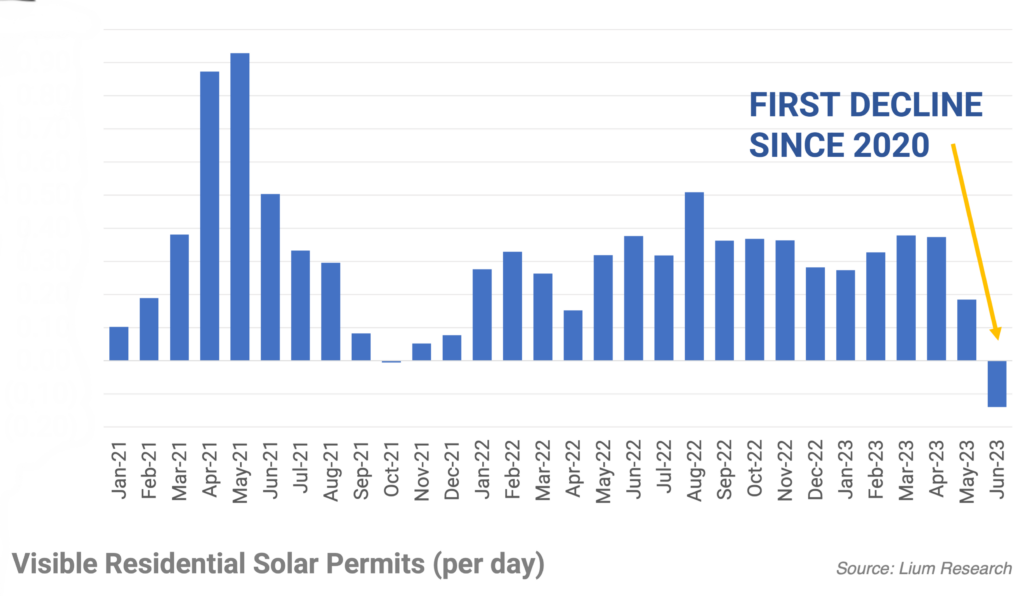
June rooftop permits declined compared to May for the first time since 2020 and landed down 15% y/y. July has started off even worse, with the July 4 week down 20% compared to the same week a year ago.
SOLARSAT™: June BIG month for new construction starts
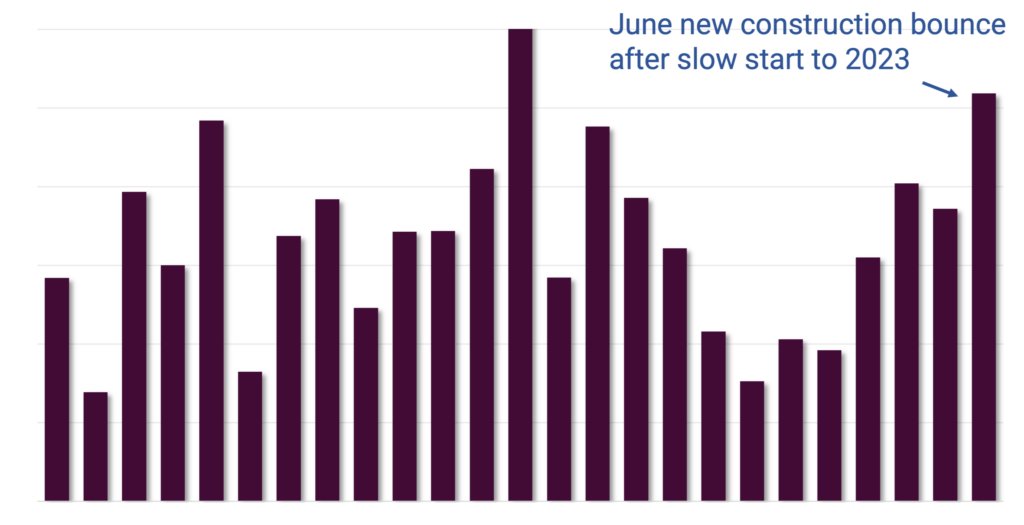
roughly 2.5 GWac (30 GW annually) of new solar was started in June, suggesting that tracker demand can continue to grow despite mediocre new construction in early 2023
New generation, capacity, utilization data; NXT scores better than ARRY; FSLR on par
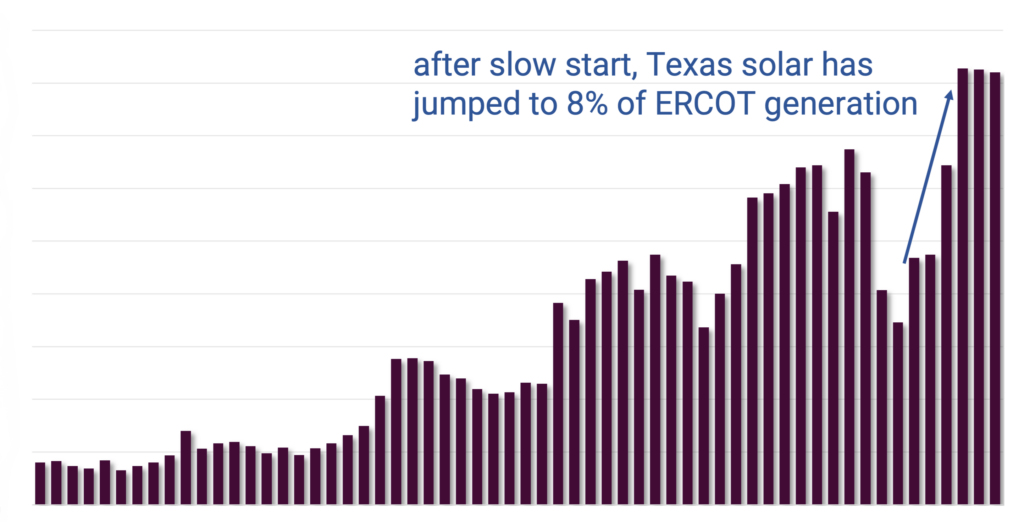
Generally speaking, solar generation has been disappointing in H1’23, increasing by a modest 7% (lagging the 20% growth in solar capacity over the same period).
WIND: U.S. Offshore Data Refresh

We remain confident in this nascent renewable power sector’s potential to achieve the 2021-set Federal goal of 30GW online by 2030.
Updating Q2 data and full year estimates

With a summer ramp looking much more subdued than last year, we are anticipating H2’23E permits to decline 10-15% from H2’22.