
2024 Outlook – Interconnections surge again (50% above Woodmac estimates); New construction +15-20%
In this note, we are updating our utility solar model (LS-1), highlighting forecasts for interconnections, new construction, trackers, and panel installations.
4Q Pipeline Update (still growing after another 11 GWac originations); NXT/PWR/SOLV/PRIM most leverage
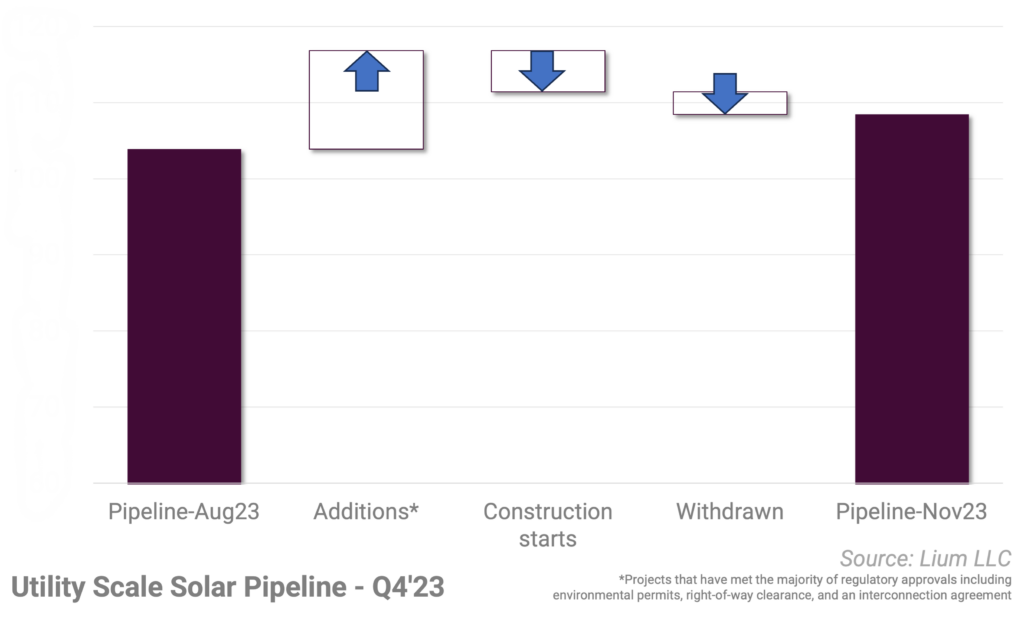
In this note, we are updating our list of of U.S. utility scale solar projects that are in the late stage development pipeline (defined as regulatory hurdles cleared such as environmental siting, right-of-way clearance, interconnection agreement).
SOLARSAT™: November new construction slowing for the winter
During November we counted roughly 1.7 GWac of projects that kicked off during the month.
SOLARSAT™: October new construction still firm (up >20% y/y)
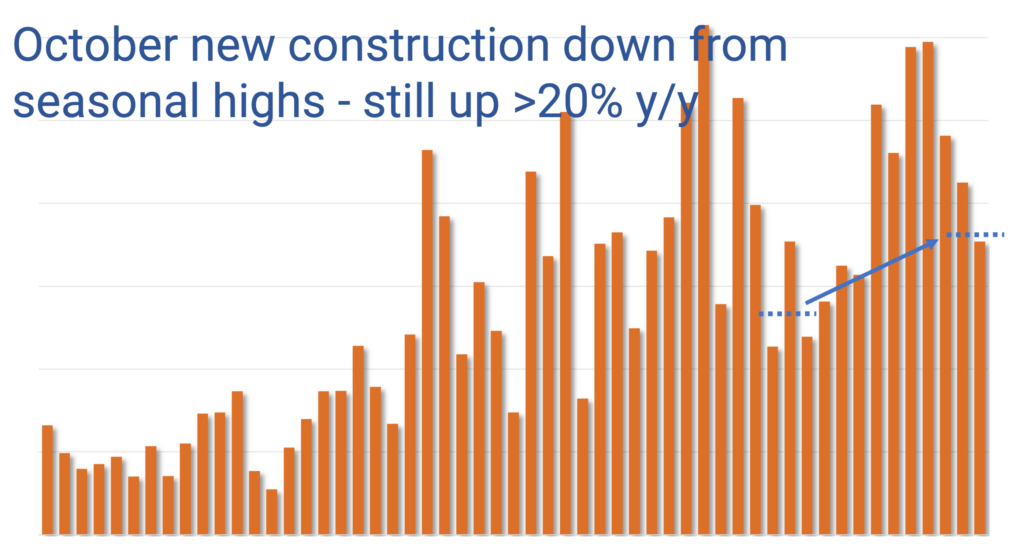
One of the constants we have found in utility scale solar development is that ALL projects experience delays
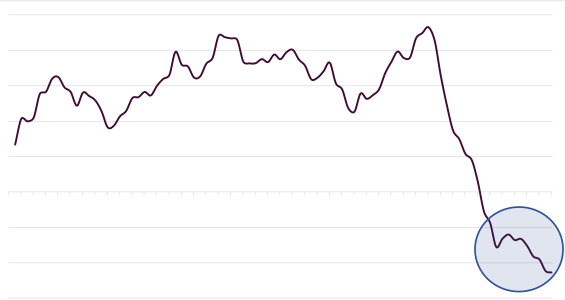
October permits still getting worse

Halfway through October, U.S. residential solar permits continue to trend lower.
SOLARSAT™: If developers are going to slow down, they haven’t yet (September new construction up 25% y/y)
More than 2 GWac of projects were started in September, down from 3 GWac in June / July, but still up 25% from a year ago.
Hard landing in September….updating 2024 estimates
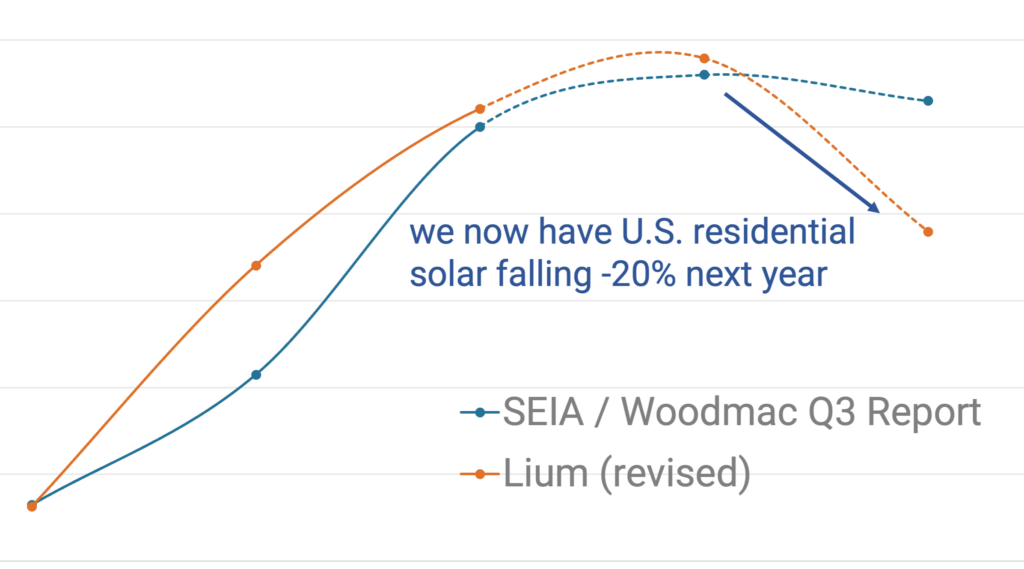
In this note we are updating our U.S. residential solar installations (RS-3) after uploading the latest round of permits and catching up with our contacts.
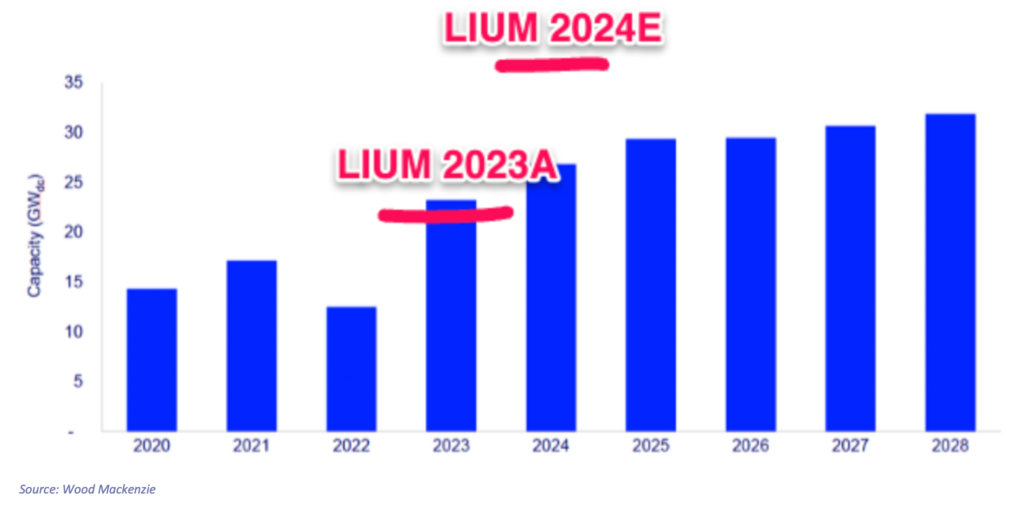
New construction hits 30 GWac 2024E (up 20-25% y/y); tracker demand more modest +10-15% y/y; Orders flat
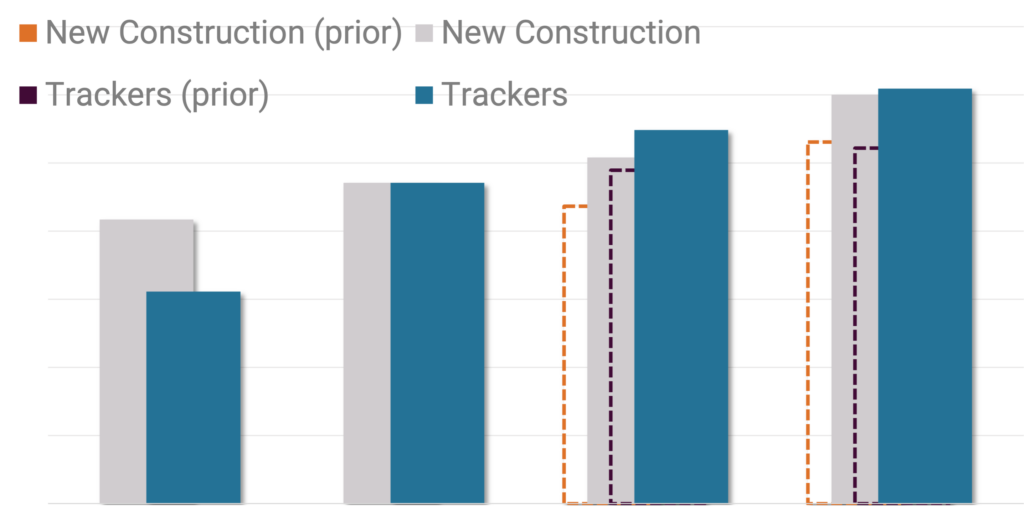
In this note we are updating our LS-1 Utility Solar Model and LS-2 Solar Database.
No sign of a rebound
Closing up August data (here), the month ended down 20% y/y for residential solar permits.
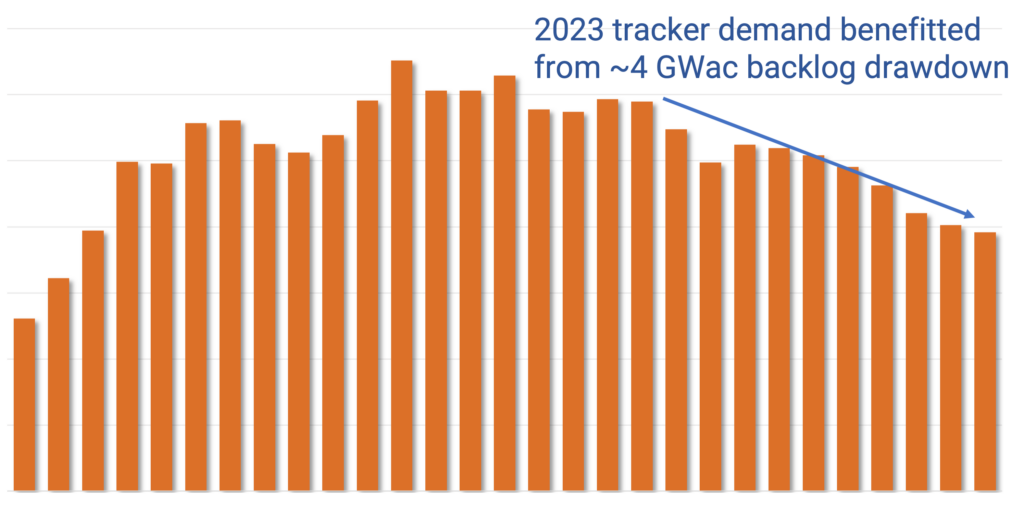
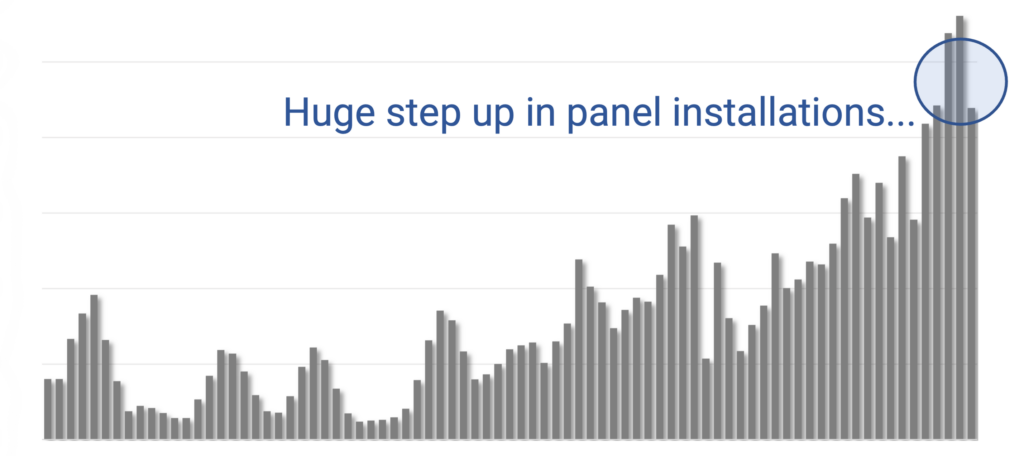
SOLARSAT™: Utility Solar full steam ahead; Q3 tracking +20% y/y; Panel installs up 2x; ARRY slow
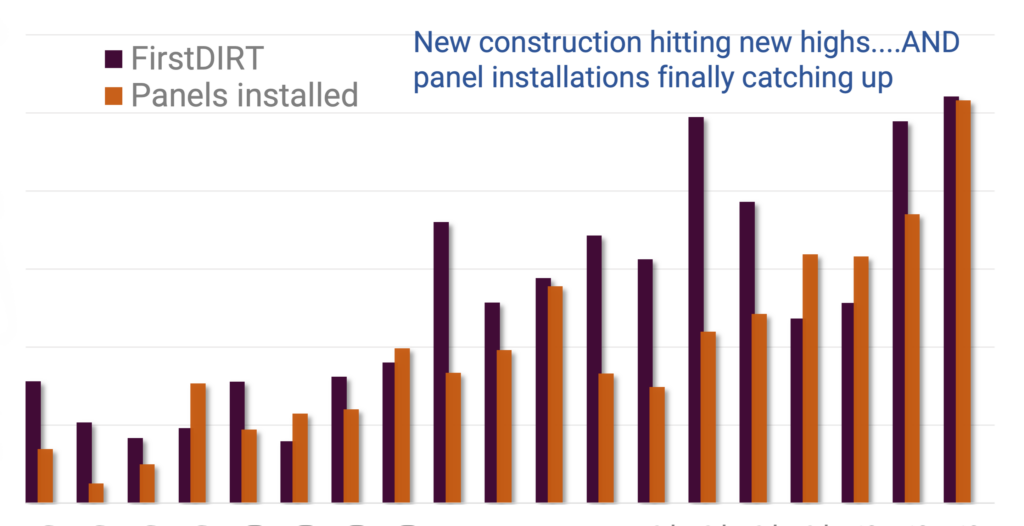
Assuming the industry continues to click, the U.S. will soon be installing 30-40 GWac (40-50 GWdc) of utility solar per year