
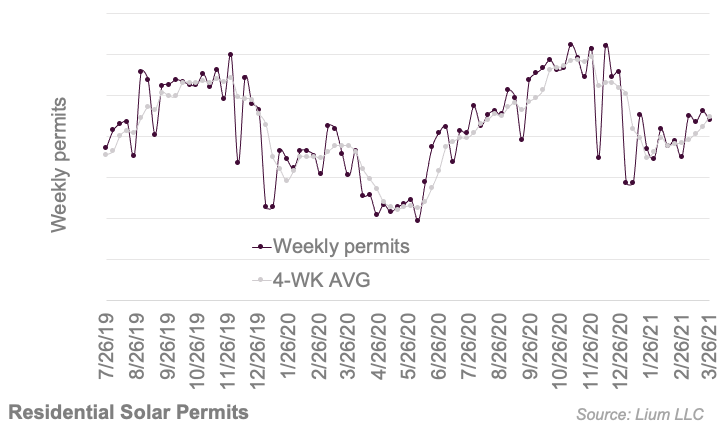
Weekly Observations
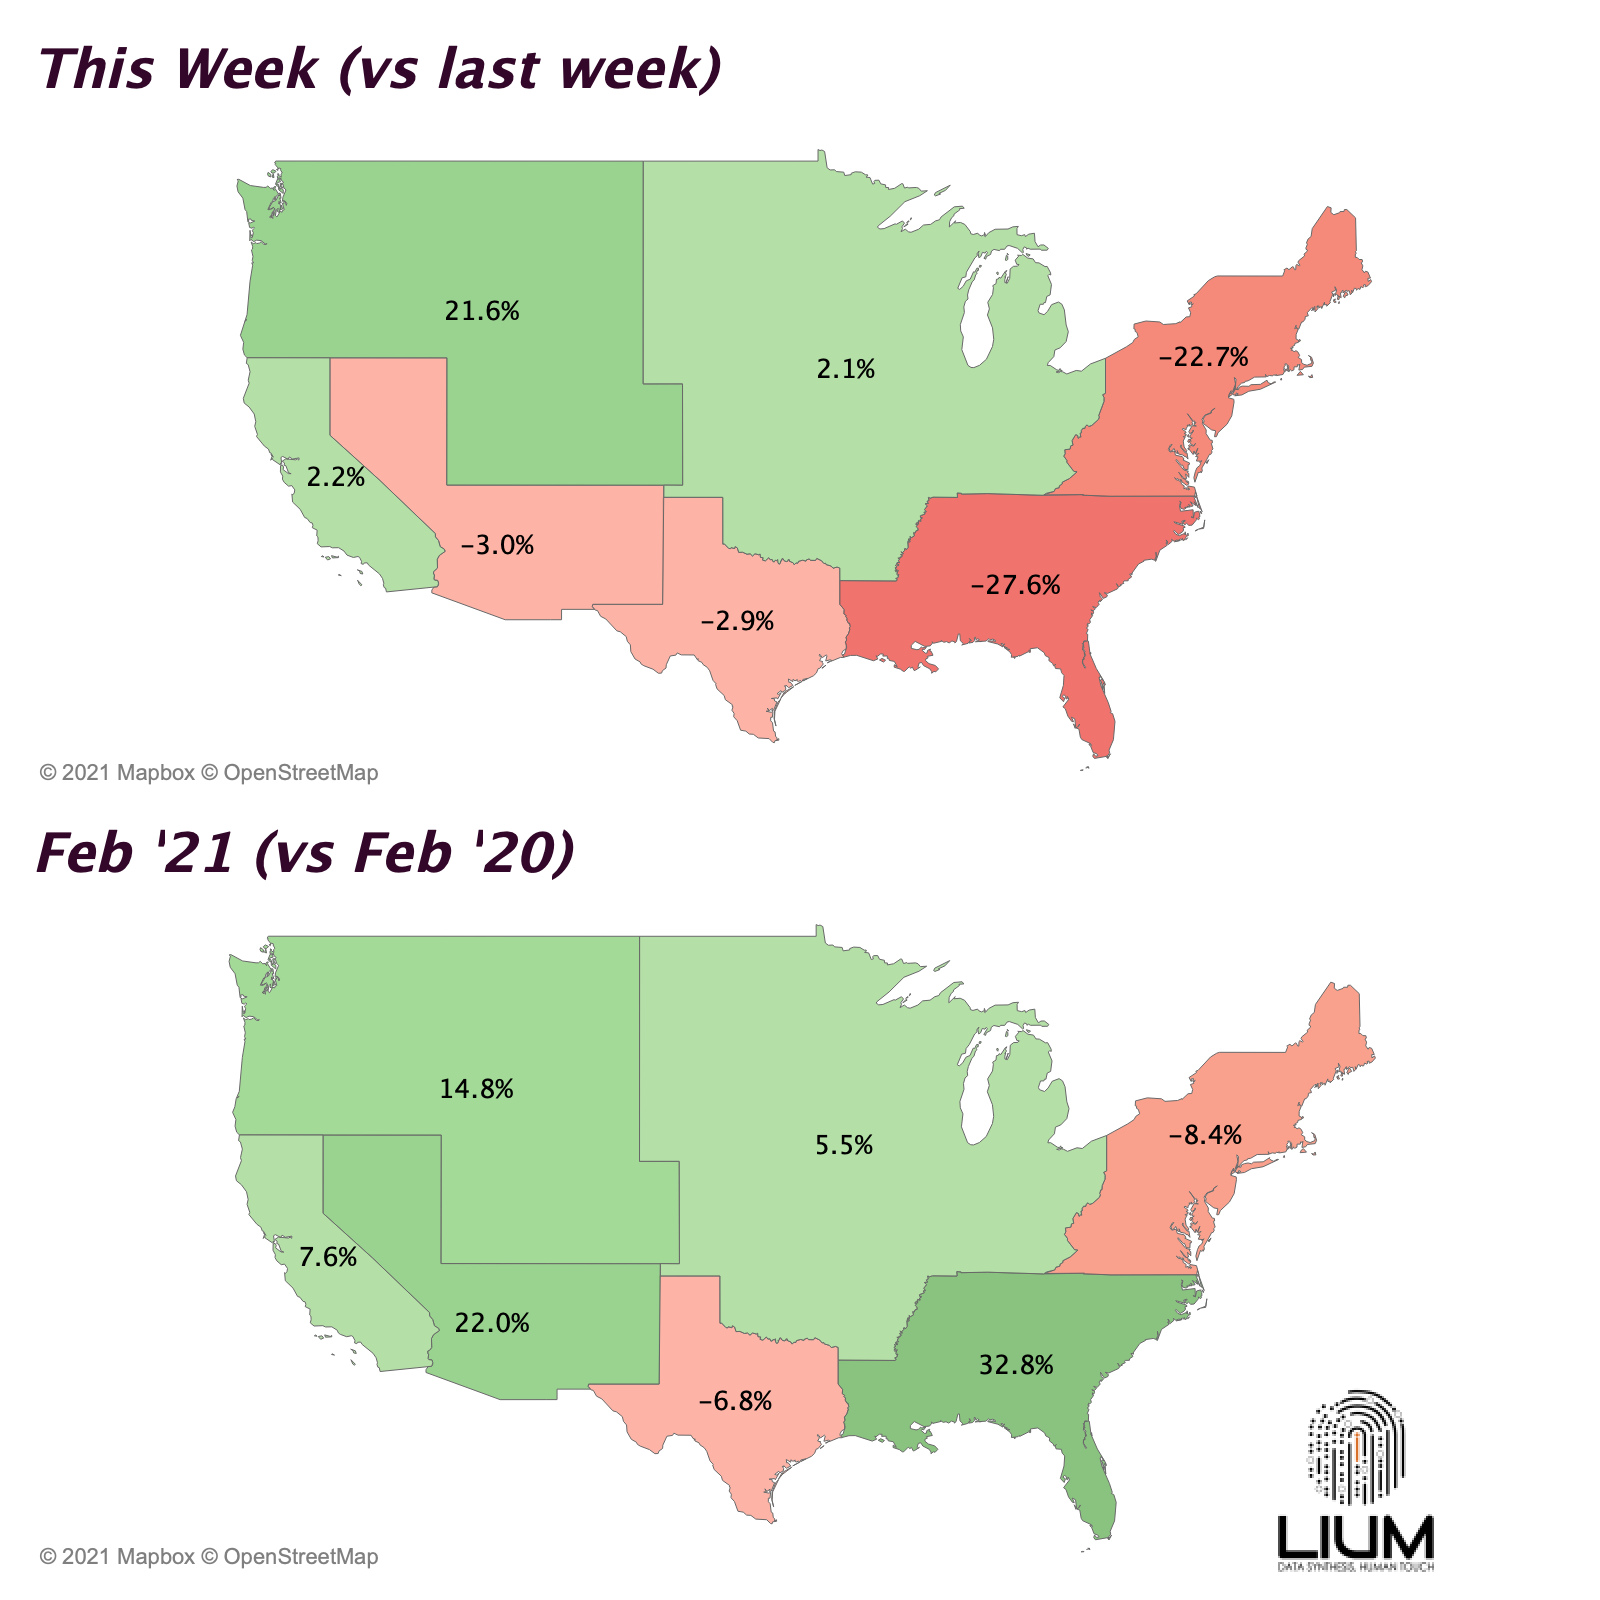
- This Week. Permits were roughly flat for the third week in a row following the big step up in early March. California was the main needle mover higher as permit activity has picked up significantly following a slow start to the year. It is notable that this is the week a year ago that solar permits started to fall because of the pandemic, making the current year comparison very favorable (this week was up 30% compared to last year)
- March. For March, permits are tracking up 8% compared to February and up 20% compared to year ago levels.
- Q1’21. This quarter, permits are tracking 10% better than a year ago and down 20% compared to Q4’20 (characteristic of seasonal permit trends). Going forward, March / April / May are typically very strong permit & installation months. To reach 25-35% installation growth in 2021 (consensus expectations), permit activity needs to grow ~10% per month through June.
- Next Quarter. Looking forward, using this week’s run rate would imply that Q2’21 increases by 9% sequentially and would be 40% better than year ago levels.
Join Lium For Free And Get Industry Situation Briefs Like This Sent To Your Inbox… Or Check Out Our Premium Membership Plans Here To Explore The Underlying Data, Predictive Models, In-Depth Reports & More…