
NEM 3 (Week 4) – Still holding up better than expected
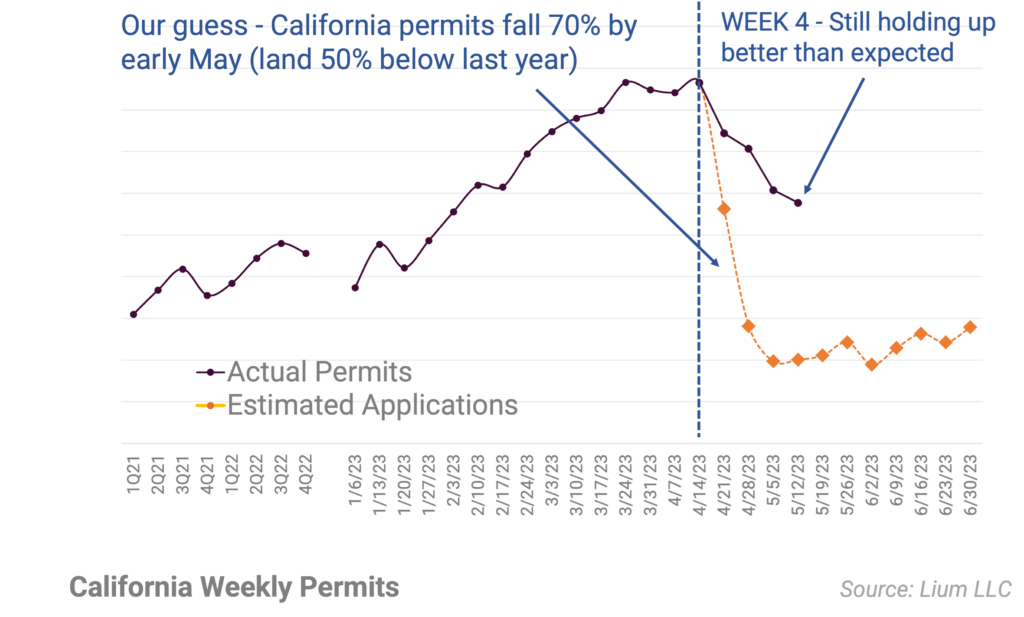
Since April 14, permit activity in cities switching to California NEM 3.0 have declined by roughly 35% peak-to-trough.
NEM 3 (Week 3) – Searching for bottom
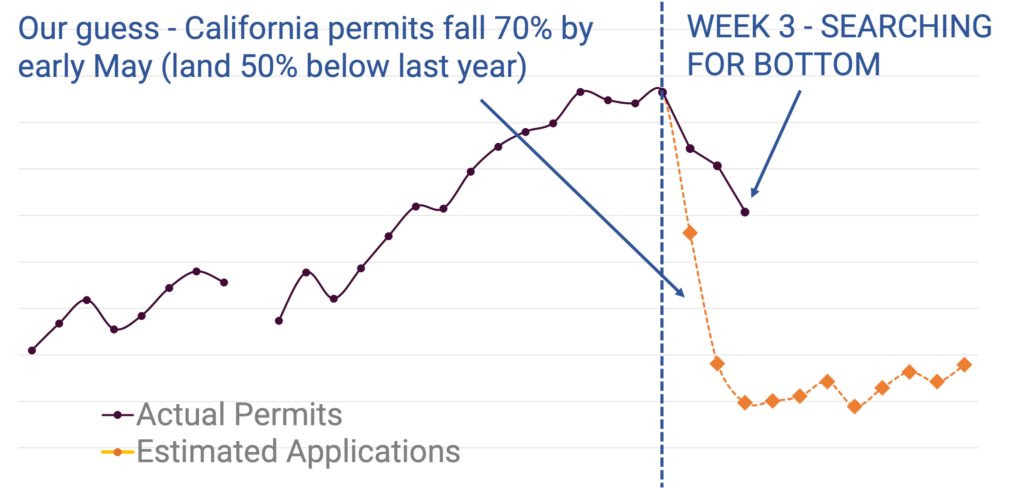
For the week ended May 5th, California residential solar permits declined by another 13% and are now tracking down more than ~30% since the onset of NEM 3.0.
SOLARSAT™: Great April for new construction starts; Panel flows disappointing
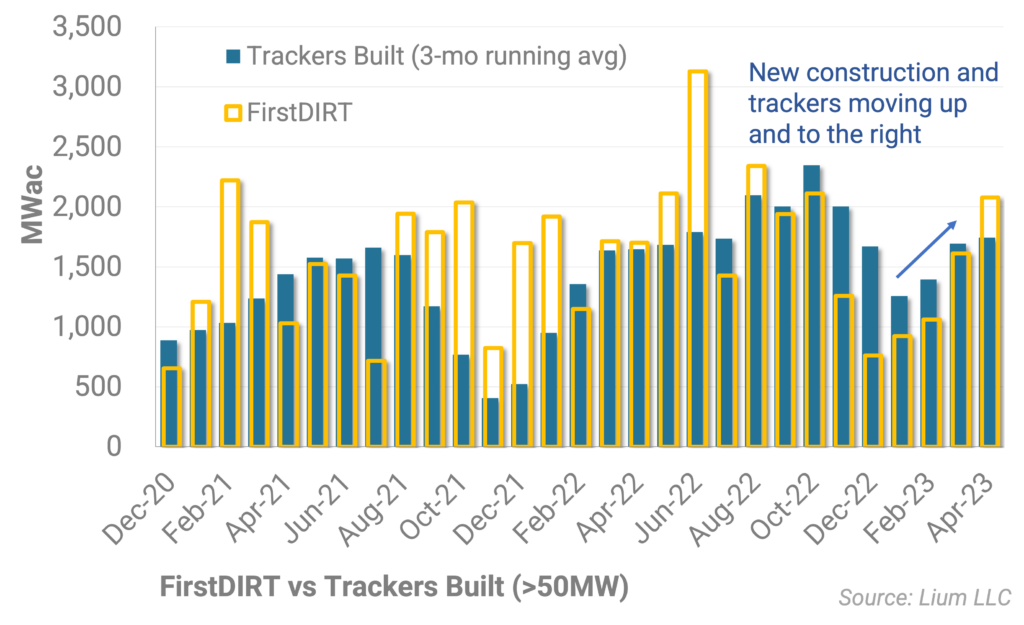
After a relatively slow winter, April new construction starts have picked back up to ~25 GWac annually.
NEM 3 (Week 2) – Steady decline but not a free fall
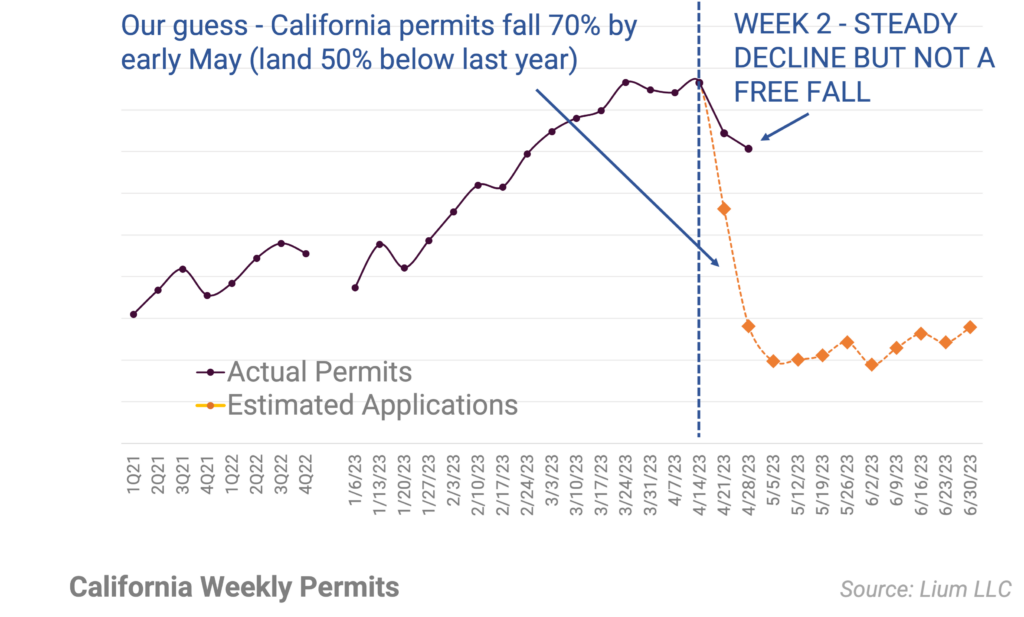
While the full force of NEM 3.0 has yet to hit local data, the less dramatic decline so far suggests installations could be better than expected over the next 3-9 months.
NEM 3 (Week 1) – Not too bad
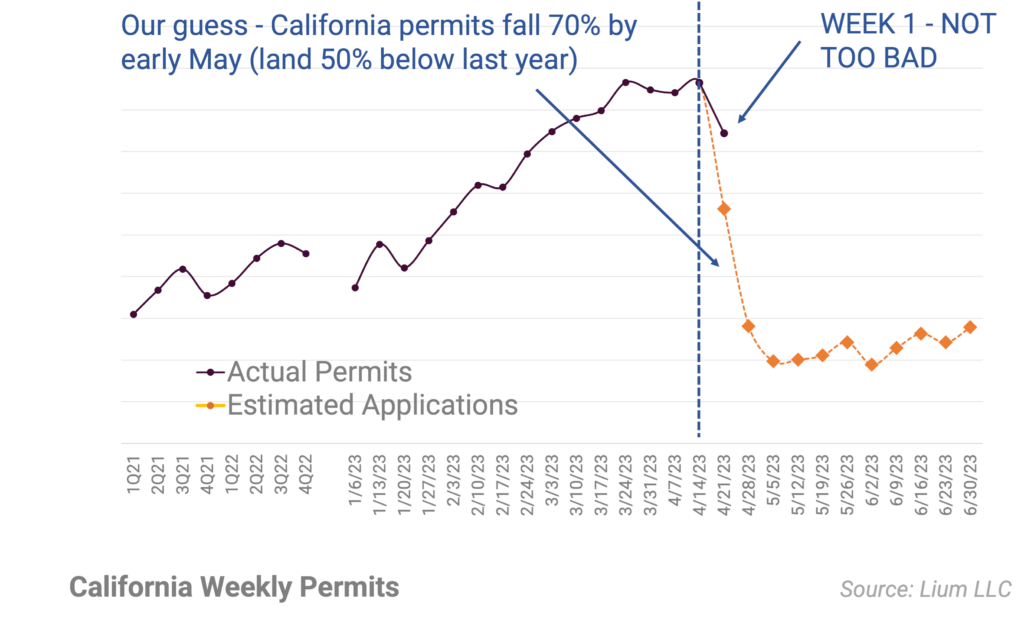
We think the first week was fairly constructive with permits in the state falling by less than 20% from the prior week
NEM 3 (Week 0) – Five part weekly series tracking the decline in California rooftop permits (SPWR, RUN, ENPH)
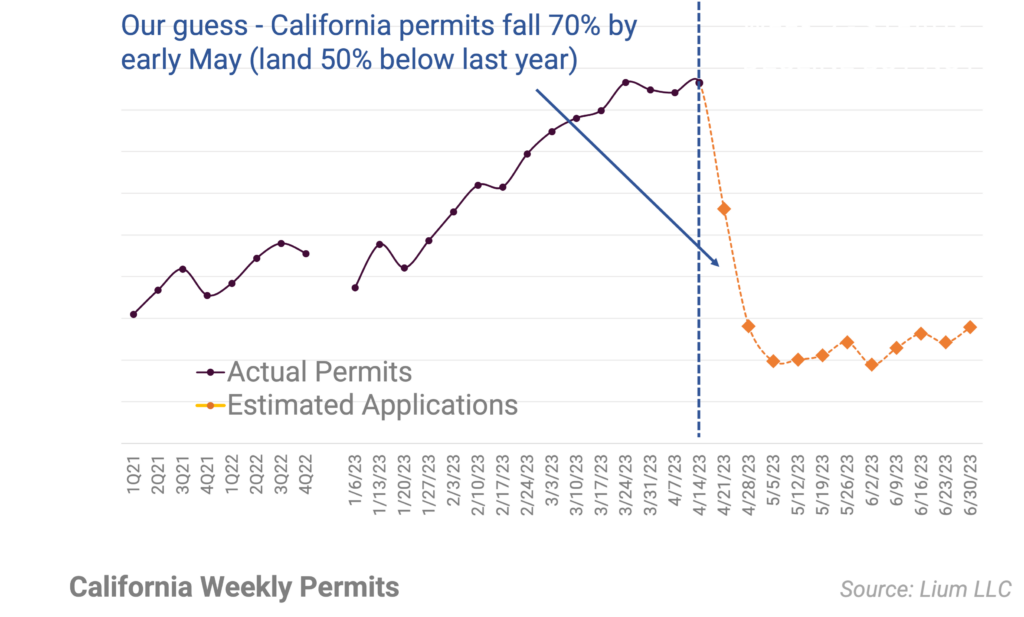
Over the last 10 weeks, California permit activity has been a moonshot as homeowners rushed to file paperwork before the NEM 3.0 April 14 deadline.
SOLARSAT™: March new construction improves sharply (after slow winter)
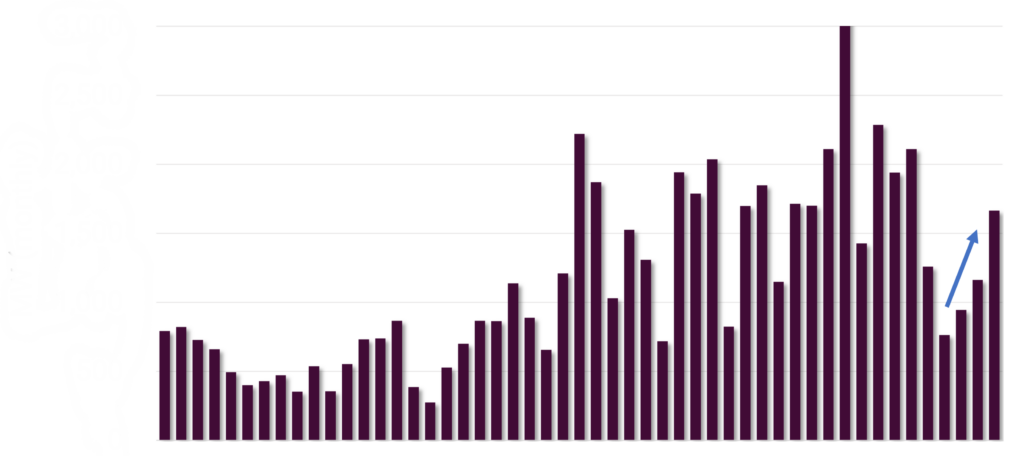
In total, we identified around 1.6 GWac of new projects kicked off during the month
Takeaways from Austin RE+ Conference

After a strong Q1, leading edge anecdotes at the Austin RE+ conference suggest that new inbounds are coming to a halt in California.
March imports continue to be strong; Cambodia (BYD, New East) big growth; Avoid EIA Monthly Shipments Report (it is wrong)
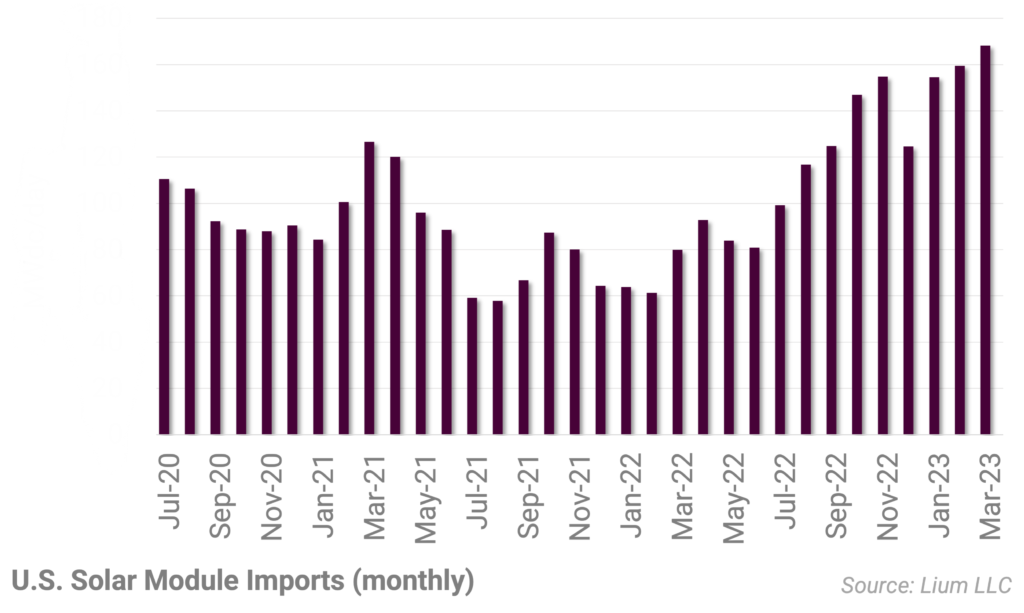
India, South Korea, and Cambodia imports have been particularly notable, collectively up 400% compared to a year ago.
Publishing new solar construction data (LS-1, LS-2)
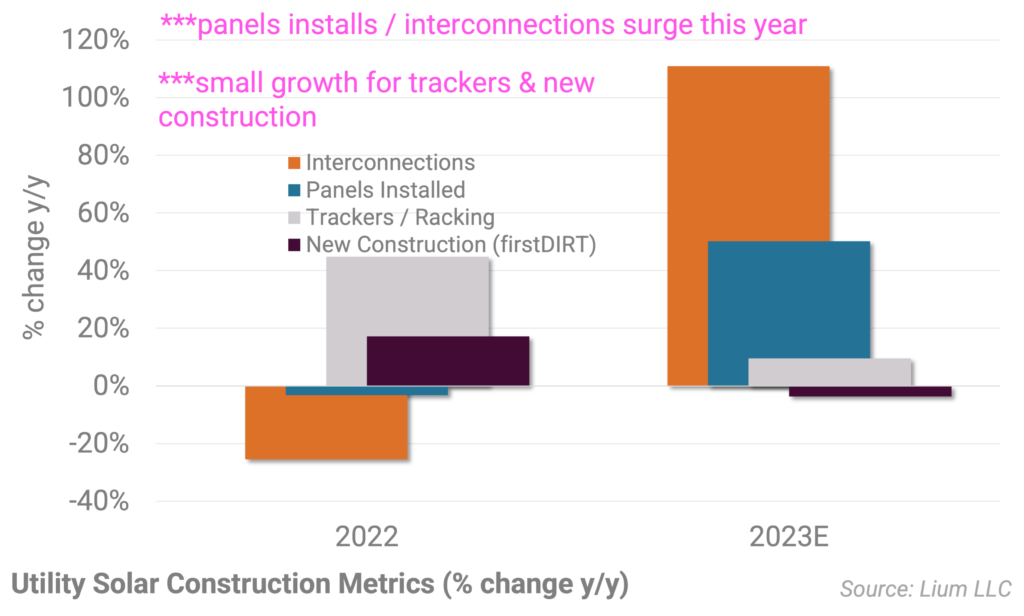
For 2023E, we are still expecting around 20 GWac to be interconnected, almost double that of 2022.