
July not bouncing back; Estimates still too high
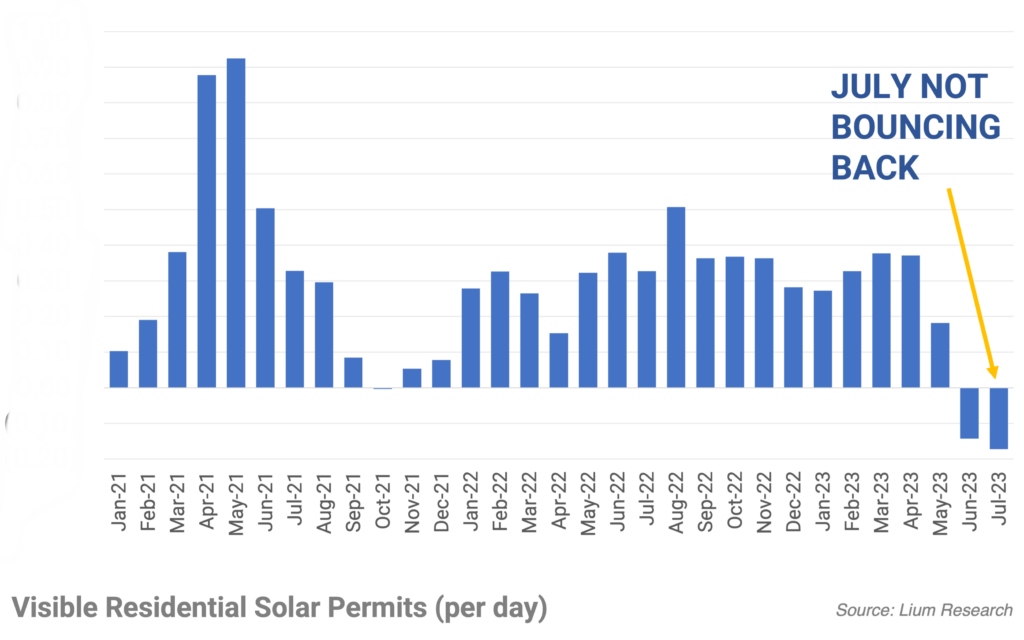
Last weeks permit activity was another disappointing datapoint, with residential solar permits down 18% y/y.
July slide deck takeaways

Panel supply flows are great compared to 2022
Terrible June followed by even slower July 4 last week
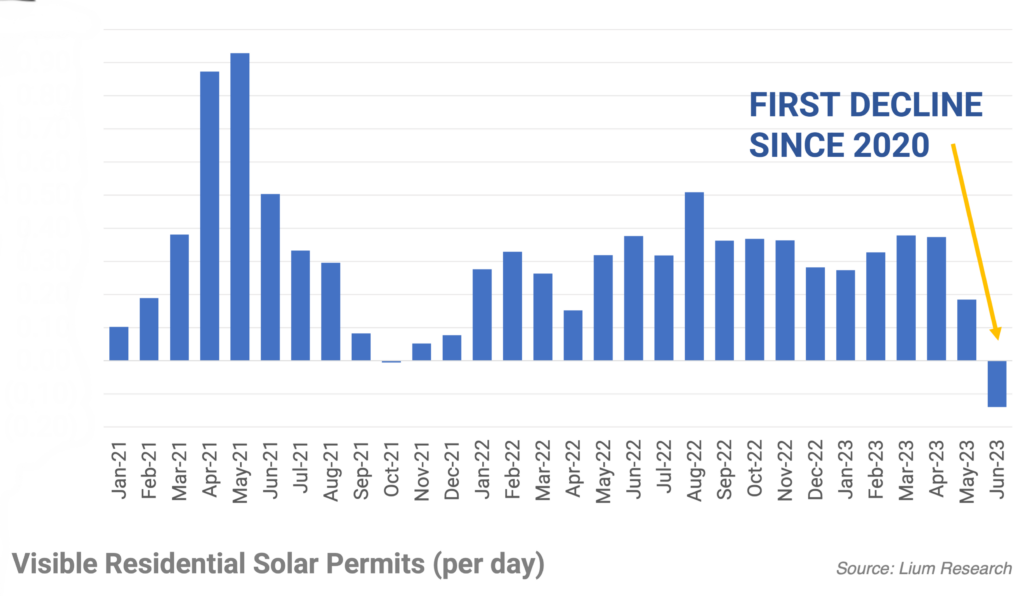
June rooftop permits declined compared to May for the first time since 2020 and landed down 15% y/y. July has started off even worse, with the July 4 week down 20% compared to the same week a year ago.
SOLARSAT™: June BIG month for new construction starts
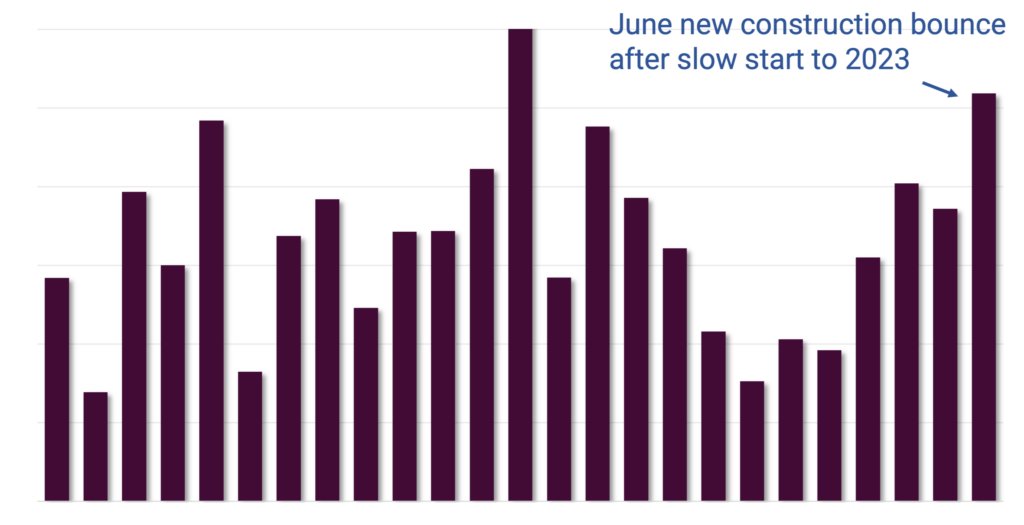
roughly 2.5 GWac (30 GW annually) of new solar was started in June, suggesting that tracker demand can continue to grow despite mediocre new construction in early 2023
New generation, capacity, utilization data; NXT scores better than ARRY; FSLR on par
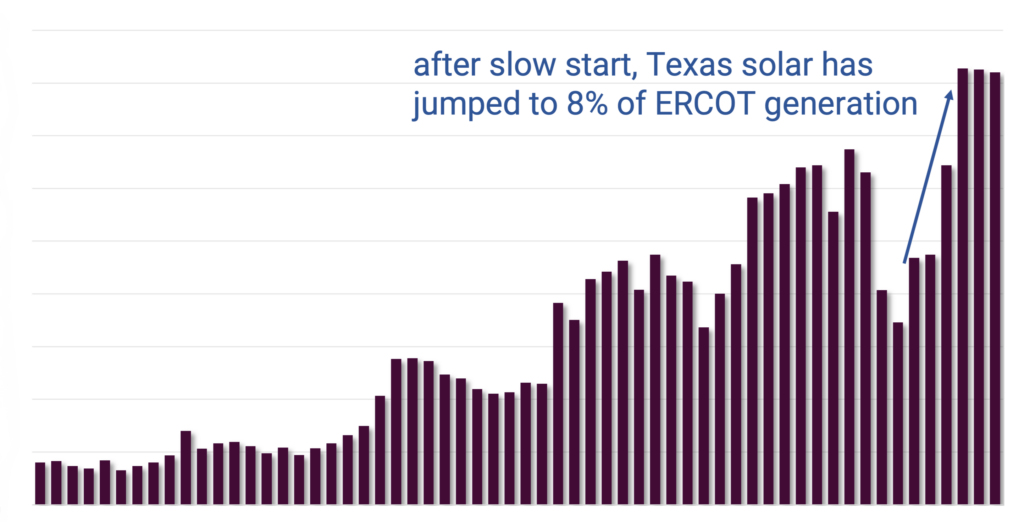
Generally speaking, solar generation has been disappointing in H1’23, increasing by a modest 7% (lagging the 20% growth in solar capacity over the same period).
Updating Q2 data and full year estimates

With a summer ramp looking much more subdued than last year, we are anticipating H2’23E permits to decline 10-15% from H2’22.
Model update – H1 Firm, H2 Risks
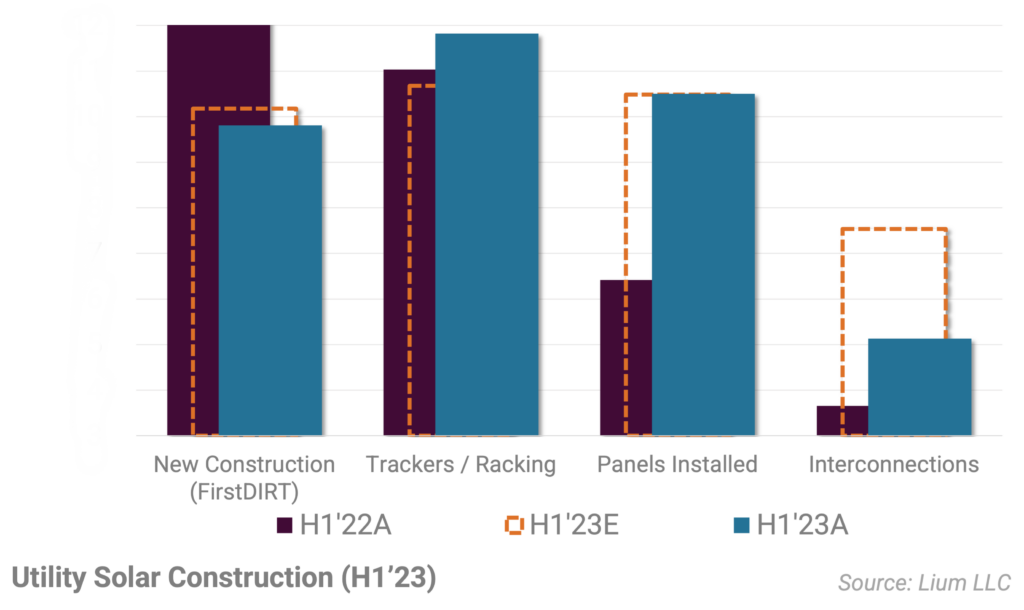
Although we are still waiting on final June data, utility scale construction metrics have generally been mixed relative to our original expectations for H1’23.
May still clinging to up y/y (June will not be)

According to our data, May U.S. residential permits declined 7% from April but still clinging to up 15% compared to last year.
SOLARSAT™: May construction picking up speed, but panel installations still falling behind
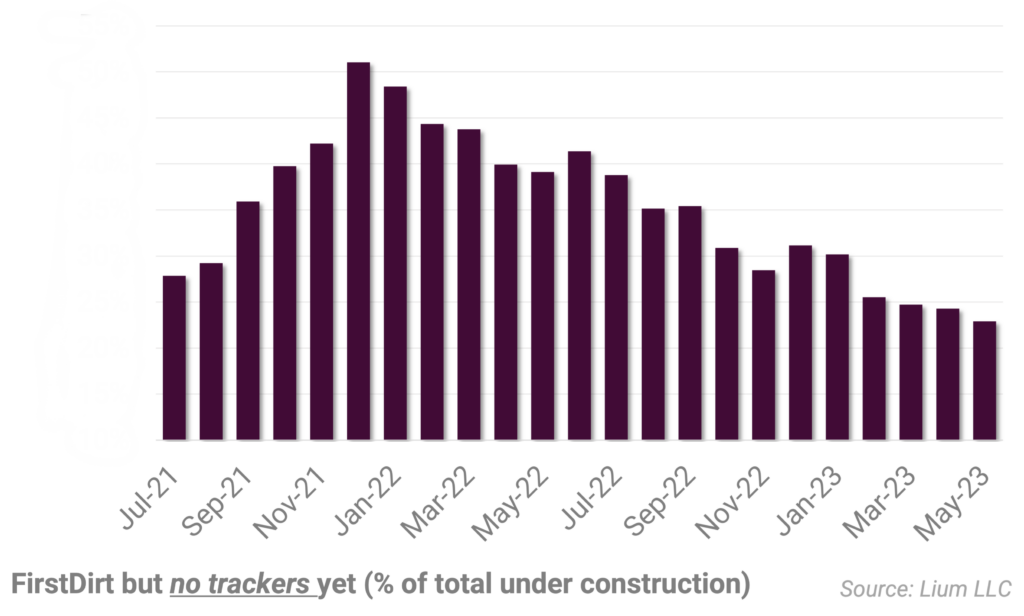
While new construction starts and tracker activity is progressing as expected in Q2, the conversion to panel installation is concerning.
Import flows still good, but decelerating
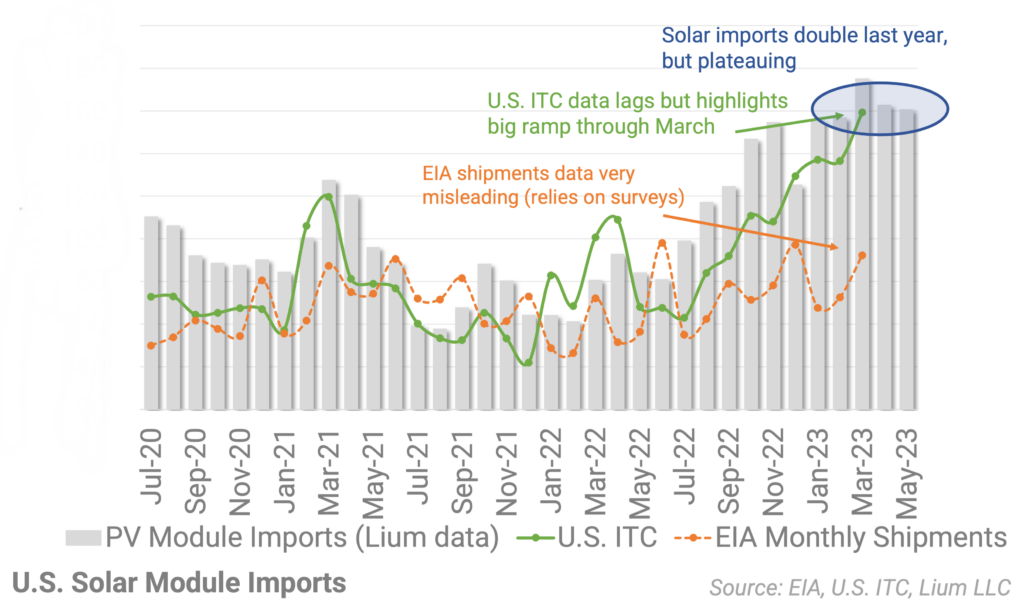
The U.S. imported roughly double the volume of solar modules in April and early May compared to a year ago.