
AD/CVD pockets of risk, but mostly exaggerated

In this note, we summarize our recent data collected surrounding U.S. solar module imports and solar demand as it relates to AD/CVD risk.
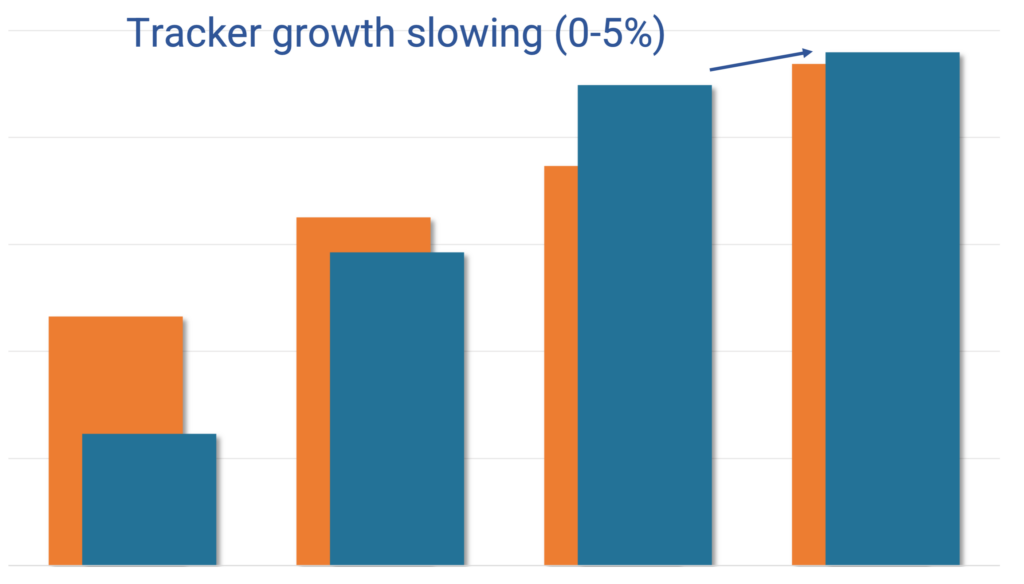
Lowering 2024E tracker forecast (now +0-5%); New construction starts on schedule
After seeing the pace of 1Q starts, collecting new permits / interconnections agreements, and reassessing our developer forecast, we are maintaining our new construction forecast at 15-20% in 2024E.
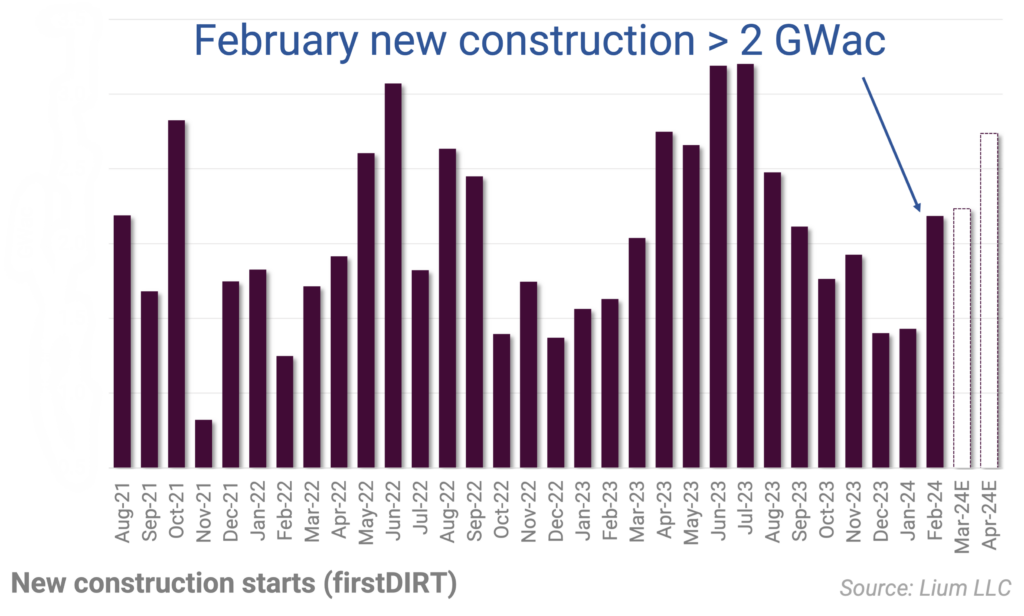
SOLARSAT™: Seasonal uptick continues w/ March new construction @ 2.4 GWac (+15% y/y); Mostly Nextera, others flat; Tracker installations disappoint
Generally speaking, the seasonal uptick is happening with March noticeably higher for both new construction starts and tracker installations.
Late Stage Pipeline Update – up again, but growth slowing (only ~10 GWac contracts signed last 3 months vs 60 GWac in 2023)
Broadly speaking, the utility scale solar pipeline continued to grow in Q1’24, hitting 112 GWac of projects that are considered to be in late stage development.
SOLARSAT™: February new construction bounce
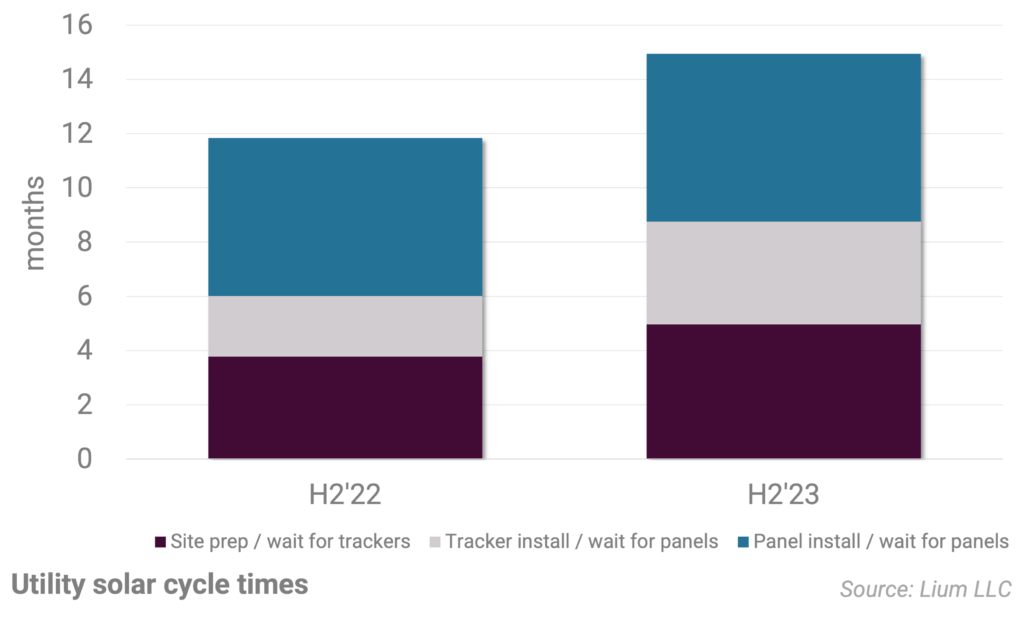
Although more than a few companies continue to stress widespread delays, we have not yet seen it in real-time construction data.
SOLARSAT™: Modest start to 2024
In this note we summarize U.S. utility solar activity from January
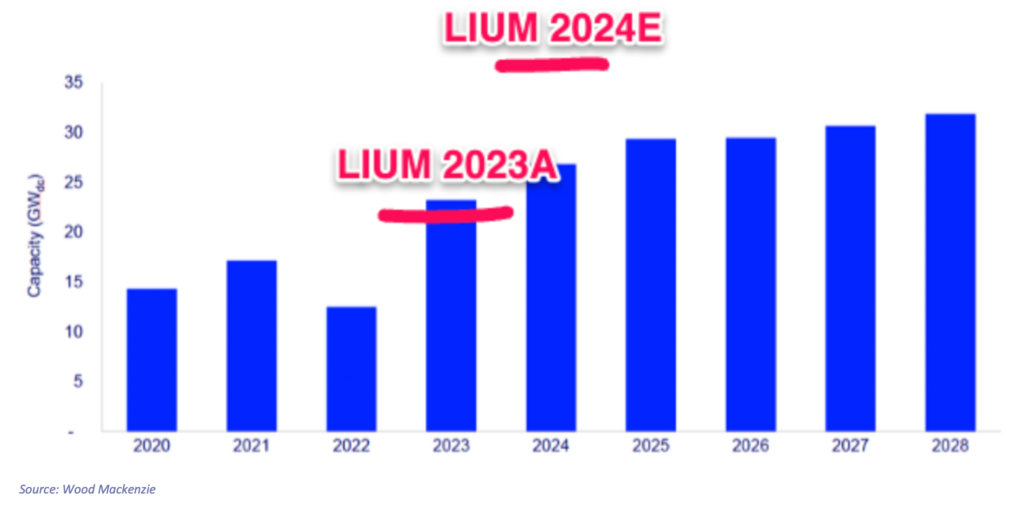
U.S. Manufacturing Study (production is ramping); +20 GWdc realistic by June 50-60 GWdc by 2025

In this study we have updated our U.S. solar module manufacturing data, focusing on facilities that are progressing through key milestones such as permit approval, facility construction, equipment installation, hiring, and final production.
Final 2023 interconnections (17.6 GWac – up 60% y/y); 2024 will surge again
This week, the EIA released final December and 2023 interconnection data, highlighting 5.6 GWac turned on in December alone.
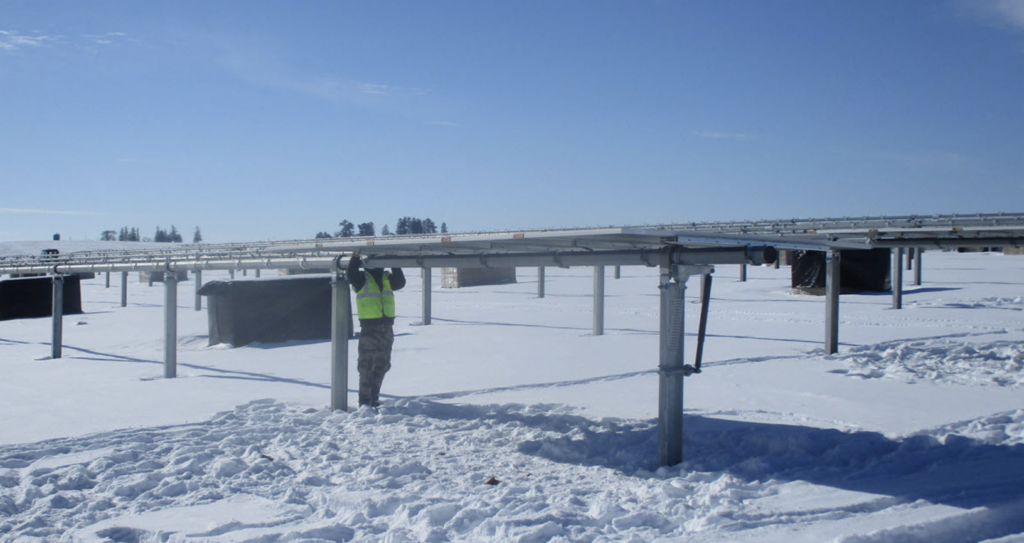
SOLARSAT™: Activity still chugging along nicely
Generally speaking, activity has continued to chug along in recent months despite fears from some public companies that developers are delaying work (ie ARRY, MTZ).
2024 Outlook – Interconnections surge again (50% above Woodmac estimates); New construction +15-20%
In this note, we are updating our utility solar model (LS-1), highlighting forecasts for interconnections, new construction, trackers, and panel installations.