

SOLARSAT™: 2025 wraps up as expected (35 GWac new site work); Installs take holiday break; Primoris spotlight (market share + efficiency gains)
In this note, we summarize the latest utility-scale solar satellite and field level data trends. Broadly...
SOLARSAT™: Panels on full tilt (9 GW installed last 3 months); Solar crew efficiency up 5-10% this year; FirstDIRT firm
Solar crew count was flat again at ~230 in November compared to October. Compared to last...

Solar train is rolling (RECORD 18 GW approved this quarter); Increasing 2027E construction projections; Applications on a downtrend
In this note, we summarize our utility-scale solar data after processing the last 3-months of construction,...

SOLARSAT™: Construction momentum remains firm (October +25% y/y); Arizona big month
October utility scale solar projects started construction... very firm for this time of year, tracking up......

Increasing 2026E projections (+10-15% y/y); Implies 50-60 more crews needed; Market share adds (Nextracker, Mastec, First Solar)
In this note, we are updating our utility-scale solar model (LS-1) which includes 2026E / 2027E...

SOLARSAT™: Q3 wraps on high note (tracker installs +20% y/y); Crew efficiency-big gains driven by big EPCs; 2026E thoughts
In this note we 1) update our September construction activity 2) provide color on the latest...

SOLARSAT™: Not yet seeing post-OBBB construction surge; Surprisingly SLOW TEXAS – driven by a MAJOR problem; PJM solar FINALLY taking flight
Contrary to the SEIA / Woodmac report this week... we are anticipating a big boost to...

New solar applications on track for >200 GWac in 2025…50 GWac will receive construction approval
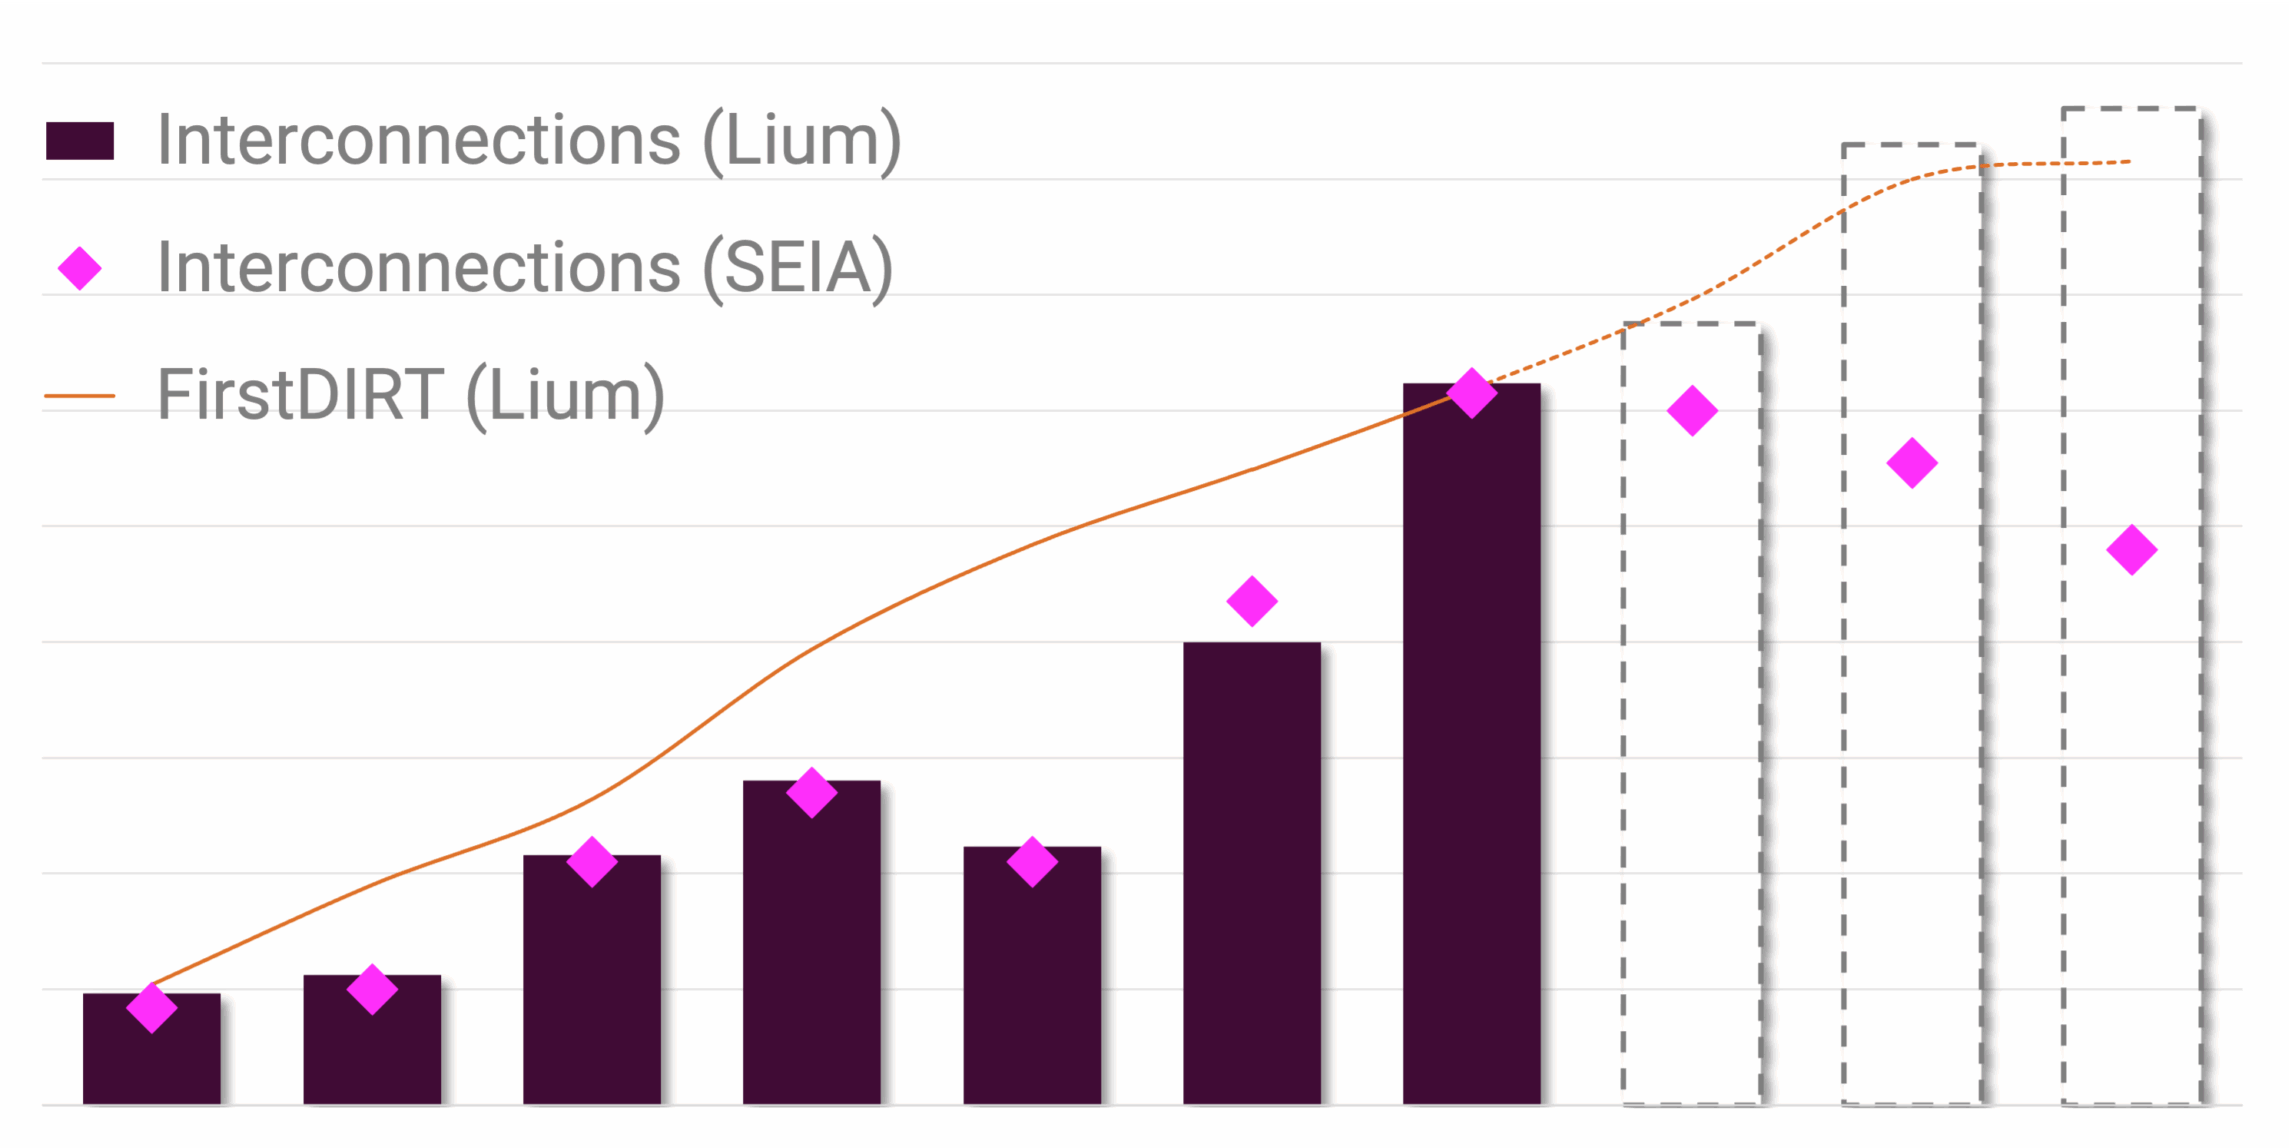
The latest data is supportive of our view that utility scale solar construction and interconnections will...

SOLARSAT™: July construction inline; On track for 8.5 GWac in Q3 (YTD +15%)
Below see key takeaways after reviewing utility-scale solar construction activity for July 2025.
SOLARSAT™: June construction bounces after May dip
After a dip in May... June new solar construction bounced back... new construction back inline with...