

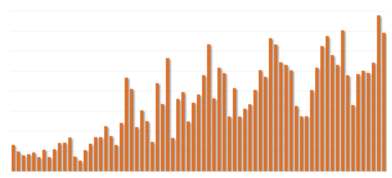
SOLARSAT™: New construction takes breather in May (worst month of 2025)…while tracker installs pick up pace
After a very strong start to 2025... new utility scale solar construction starts were oddly quiet...

Approvals post another firm quarter (proxy for orders); PJM heavy momentum; Phoenix takeaways
As of May, we now count... utility scale solar projects in the late stage pipeline... Since...
SOLARSAT™: April confirms upward trajectory; Revising estimates higher; Trackers likely up 15-20%
April saw another strong month for utility-scale solar starts with... continuing the pace set in March......
Updating project level details (LS-2) and forecasts (LS-1)
In this note we summarize the changes we have made to our project level details (LS-2)...

SOLARSAT™: March wraps up very active Q1
March new solar construction showed no signs of slowing... In fact, an additional... projects kicked off...

SOLARSAT™: Clear inflection (Q1 new starts will jump 20%+ Y/Y); 2025 forecast likely too low
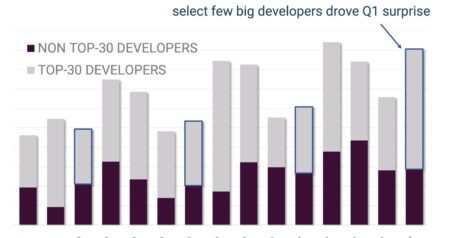
After running February satellite data... we are seeing a clear inflection in the level of new...

Pipeline firm to start 2025 (another 15 GWac approved); PJM huge driver….others ho-hum
Below we list takeaways after updating our utility scale solar database (LS-2 and PLUS-201).

SOLARSAT™: Construction off to quick start (Jan firstDIRT ~3 GWac)
During January, we identified... utility-scale solar projects that kicked off site work during the month... This...
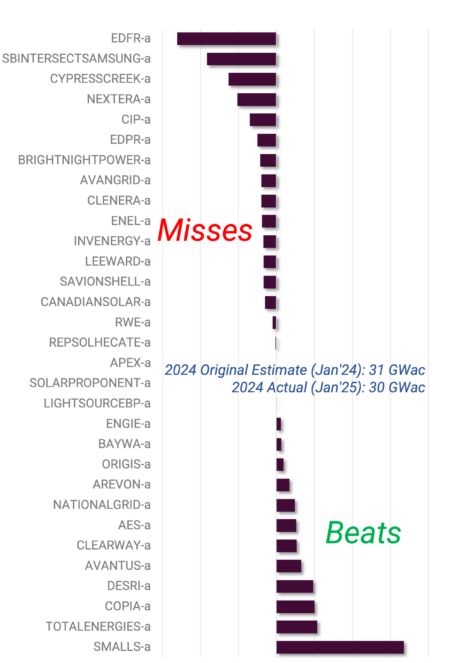
2025E update; Key themes (Nextera moderating, 12 GWac waiting for trackers, interconnection approvals rebound)
In this note we are updating our LS-1, LS-2, and PLUS-201 data sheets and forecasts... Broadly...
SOLARSAT™: Active December for site prep; PJM signs of life; Trackers land down 7% full year; Construction delays update
Below see key takeaways after going through our utility-scale solar satellite data for the month of...