
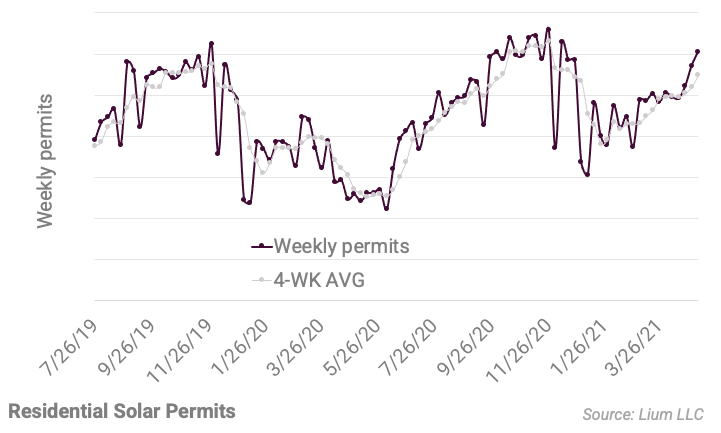
Weekly Observations
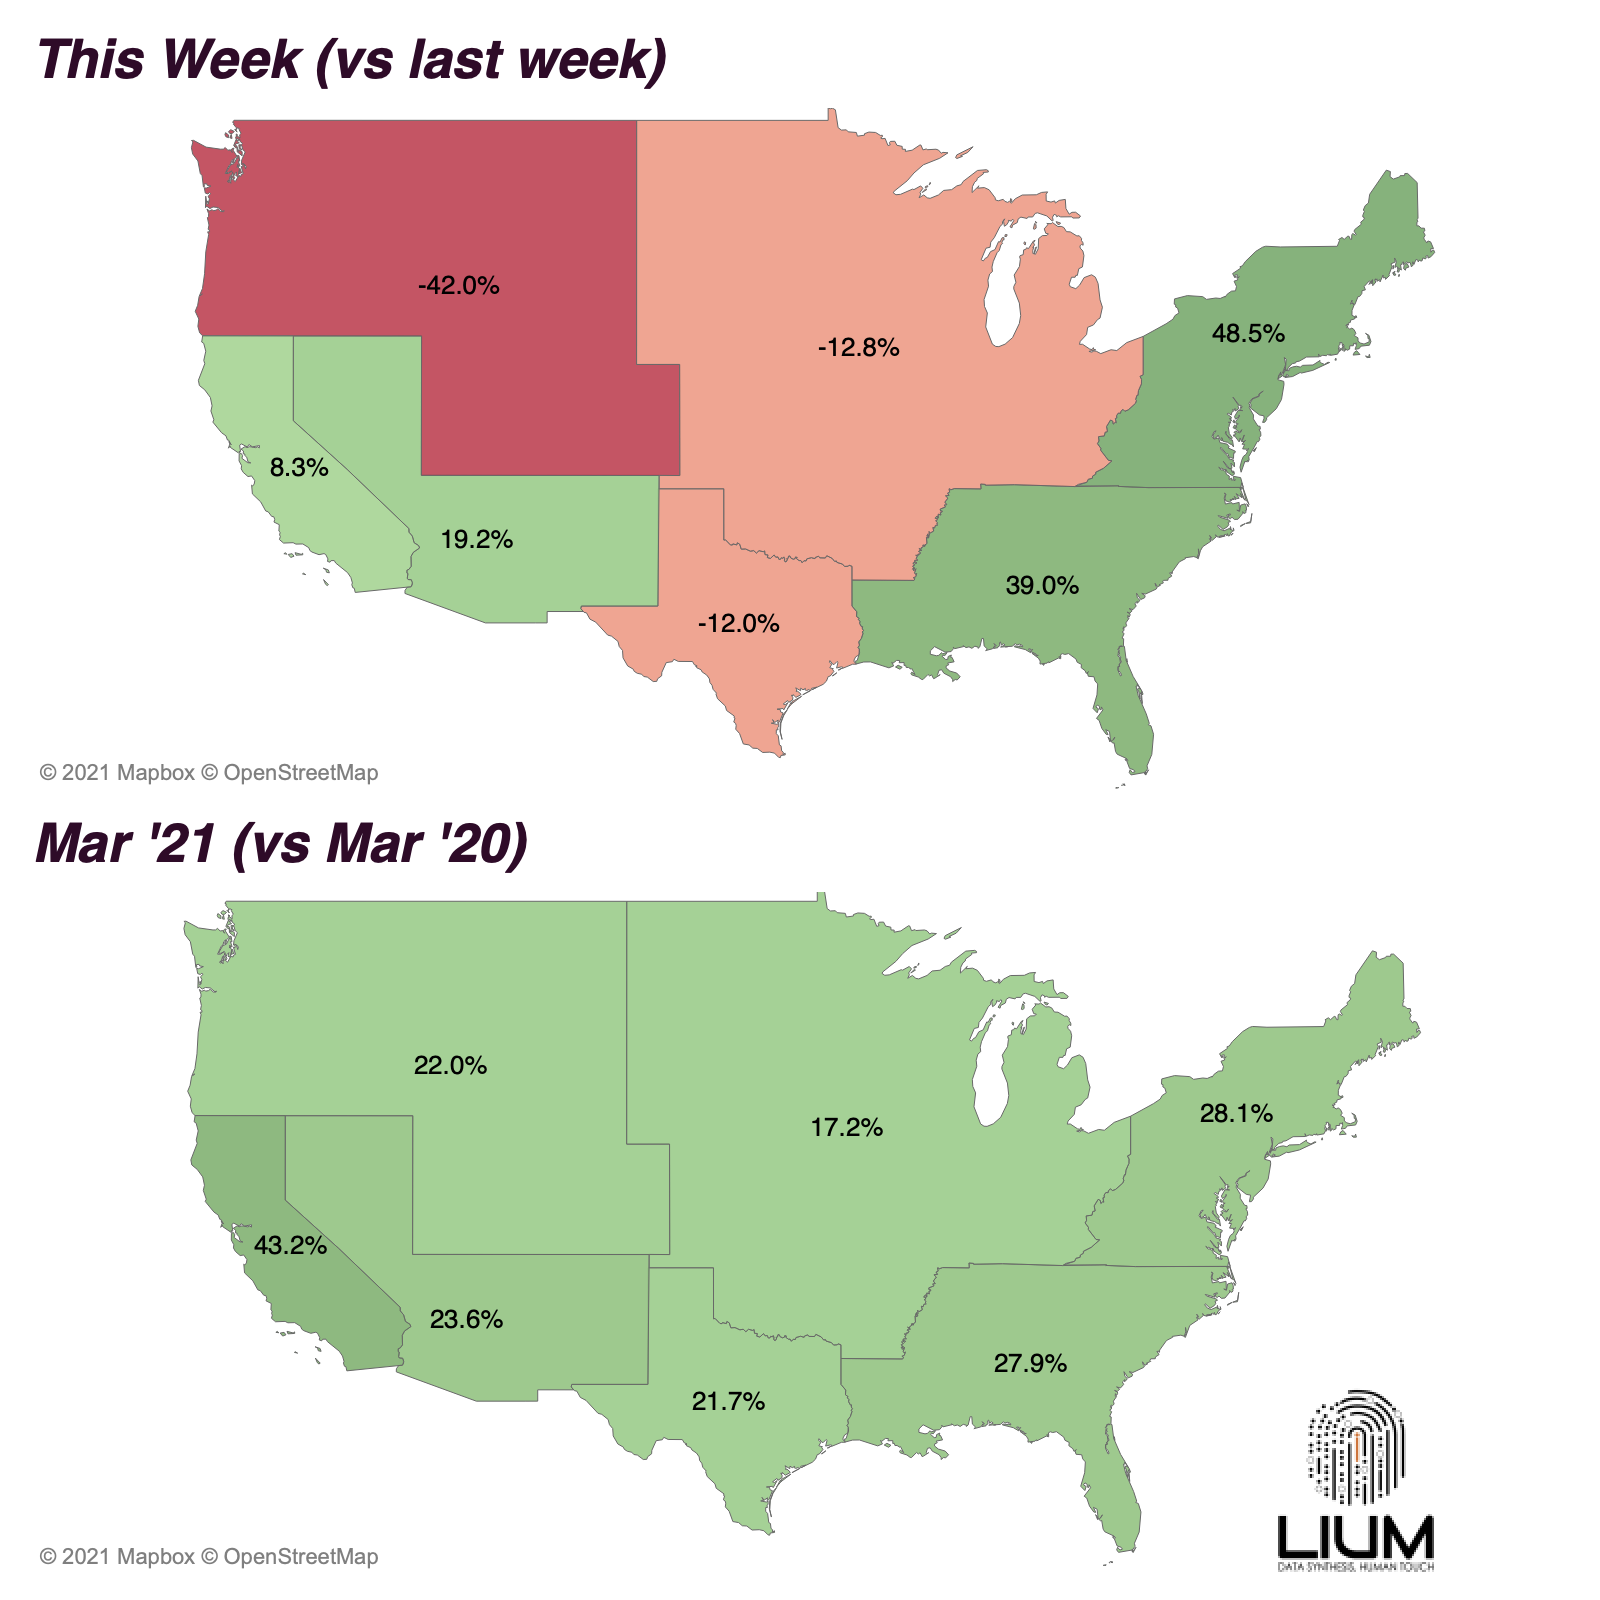
- This Week. Permit activity continues to trend upwards as this week’s data reflects a +6% W/W increase. The highest W/W variances within our solar regions were in the Northwest -42% W/W, the Southeast +39% W/W, and the East +40% W/W.
- California. Despite a slow week from the region’s largest city (Los Angeles), California finished +8% W/W thanks in part to strong weeks from San Jose, Fremont, Bakersfield, and Chula Vista, among others.
- Best Performing Cities. This week, five of our top solar cities had either their highest or second-highest week of permit issuances in 2021, a sign that things are beginning to ramp up. Out of these five, four are in the Southwest region (Albuquerque, Las Vegas, North Las Vegas, Henderson) and one is in California (San Jose).
Join Lium For Free And Get Industry Situation Briefs Like This Sent To Your Inbox… Or Check Out Our Premium Membership Plans Here To Explore The Underlying Data, Predictive Models, In-Depth Reports & More…