
SOLARSAT™ NOTE TO CLIENTS 061026
In this note, we refresh our monthly satellite and on-the-ground datasets, with May updated for FirstDirt, Trackers, Panel Installations, and Interconnections…
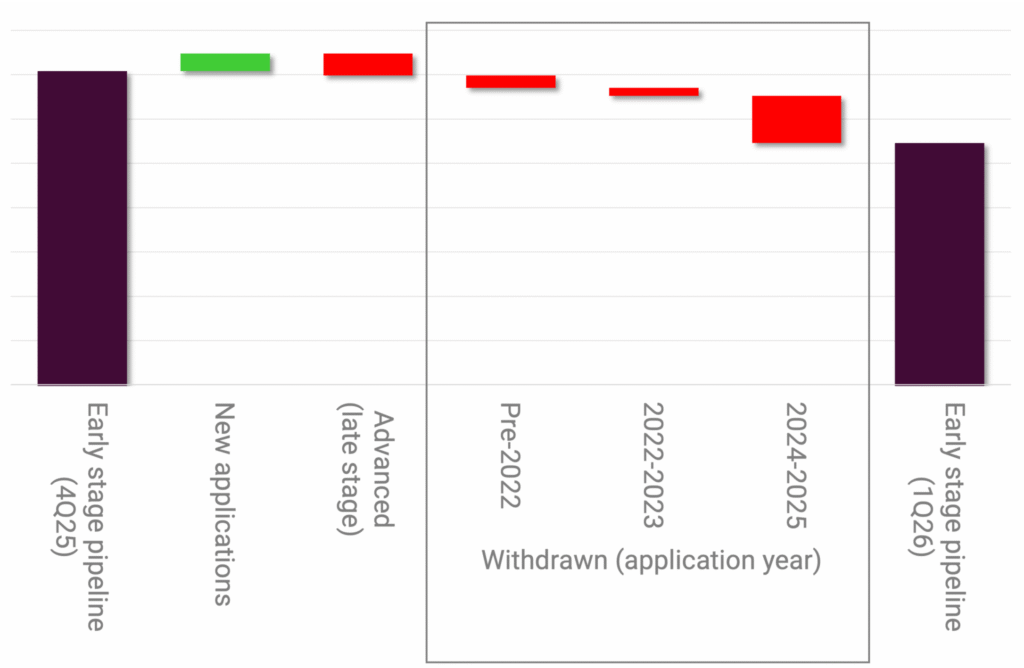
UTILITY SOLAR NOTE TO CLIENTS 060126
In this note, we update our Q2 solar development data, paying closest attention to 1) new project applications 2) projects moving into pre-contract phase and 3) projects being approved to the late stage pipeline.
SOLARSAT™ NOTE TO CLIENTS 051226

In this note, we refresh our monthly satellite and on-the-ground datasets, with April updated for FirstDirt, Trackers, Panel Installations, and Interconnections…
UTILITY SCALE SOLAR NOTE TO CLIENTS 042826
In this note, we are updating our utility solar quarterly data and forecasts to reflect the latest trends in construction starts, approvals, crew counts, and market share… cycle remains firmly intact… construction starts running better than expected… approvals and orders stronger… domestic module demand (and supply) is ramping…
SOLARSAT™: April new starts light @ 2.8 GW (lots of projects, but all small); Midwest ramp begins; crews jump
In this note, we refresh our monthly satellite and on-the-ground datasets, with March updated for FirstDirt, Trackers, Panel Installations, and Interconnections…
SOLARSAT™: EIA 860M (SEIA) is broken, ignore it; 2026 grows 10+% (albeit ho-hum start w/ low tracker installs); Nextera adds new Mortenson work
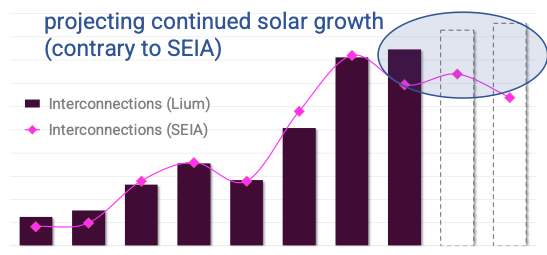
In this note, we refresh our monthly satellite and on-the-ground datasets, with February updated for FirstDirt, Trackers, Panel Installations, and Interconnections… We have also reviewed the SEIA / Woodmac report published this week…
Approvals inflect higher (25 GW this qtr); Visibility through 2027E; But new applications have dried up
In this note, we summarize our takeaways after processing the last three months of applications, permits, and approvals… utility scale solar is pacing ahead of schedule in the near / medium term… increasingly concerned about growth thereafter.
SOLARSAT™: Slow construction start (lot of bad weather); Solar crews drop 12 to 208; Solv starts massive Swenson project; Gamechange taking share
In this note, we provide an update on construction activity since the beginning of the year… Despite the slow start, we are still anticipating 2026E to post strong utility-solar construction growth… with orders and backlog also ticking higher.
Data refresh & 2026E projections; EPC mkt share favors MTZ (PWR lower 2025); Gamechange takes back share

In this note, we are updating the latest utility-scale solar data, which includes our projections for industry metrics such new approvals / construction / installations and company specific such as EPC / tracker / module market share…
SOLARSAT™: 2025 wraps up as expected (35 GWac new site work); Installs take holiday break; Primoris spotlight (market share + efficiency gains)
In this note, we summarize the latest utility-scale solar satellite and field level data trends. Broadly speaking, the end of the year wrapped up about as expected with another…