
Interconnection approvals rebound…driven by big projects in desert states…benefitting from wave of queue requests 3-5 years ago

Following a slow start to 2024, interconnection approvals have rebounded since June.
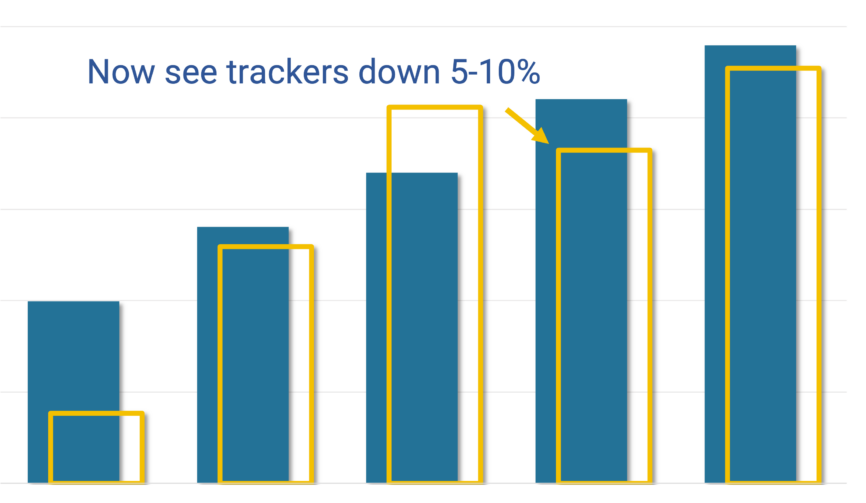
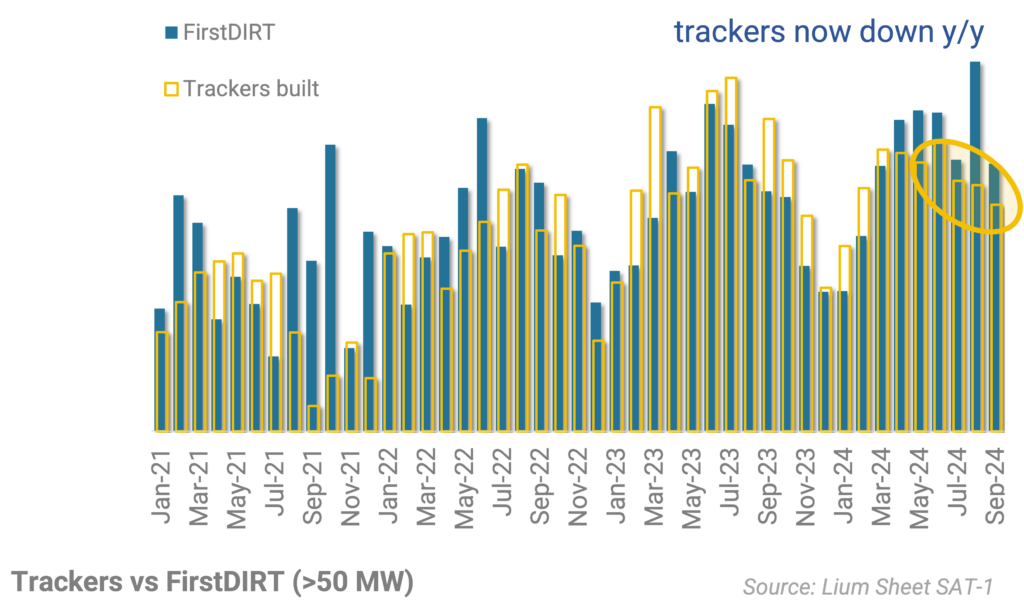
SOLARSAT™: Oct solar construction of soft side (<2GW); 85% new activity in Trump states; Trackers on pace for down 5-10% y/y

Little less than 2 GWac of new projects kicked off during October
Modest summer rebound; October noticeably lower; 2025E projection @ +5%

With more than half of October now in, we are updating our Q4 and 2025E residential solar projections (RS-3).
Model update…2024 trackers DOWN 5-10% (new construction +15%); 2025E signs of +10-20%
In this note, we are updating our 2024/2025 Utility Scale Solar Model (LS-1) after putting in actuals through September and refreshing our project / developer level forecast.
SOLARSAT™: September new starts firm again (2.6 GWac); Q3 lands +12% y/y; Tracker installs soft
After a record August, September new construction has remained firm. Specifically, 2.6 GWac of new projects kicked off construction during September, down from almost 4 GWac last month, but still tracking well ahead of last year.
Refreshing data sheets to reflect latest construction starts (LS-2, PLUS-201); 2025E tracker outlook improving

In this note, we are updating our LS-2 and PLUS-201 files to reflect the latest satellite and company data.
SOLARSAT™: Huge August for new construction starts (3Q tracking +20% y/y)

After a disappointing July, new construction starts have seen a huge bounce in August. In fact, almost 4 GWac of projects kicked off during August, the best month of activity for U.S. utility solar so far. For 2024E full year, new construction starts are very much on track to hit our original projection of 15-20% y/y. Meanwhile, tracker demand has not yet caught up to new construction starts and remains on track for flat 2024E.
Deeper Dive To Understand Project Delays

As a broad takeaway, delays in project developments are slightly more elevated now, but NOT significantly different than other historical periods.
Pipeline update (approvals get support after 3 down qtrs); TX strong as ever; CAISO/PJM terrible

In this update, we have processed the new interconnection approvals that have been executed over the last three months.
SOLARSAT™: July takes a breather (down 15% from Q2 average)

After a big June and Q2, new utility solar construction took a breather in July posting only ~2.5 GWac compared to ~3 GWac per month since April.