
Pipeline update (approvals get support after 3 down qtrs); TX strong as ever; CAISO/PJM terrible

In this update, we have processed the new interconnection approvals that have been executed over the last three months.
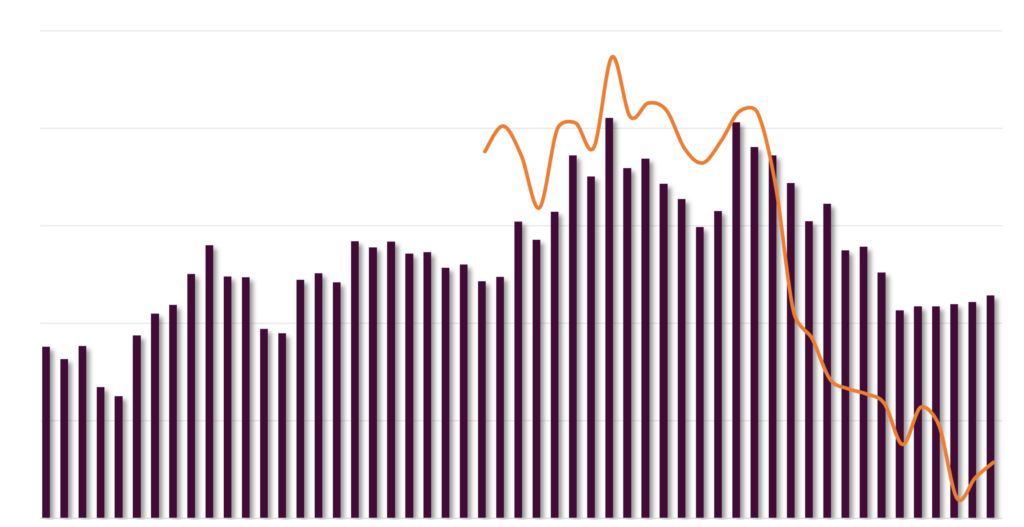
SOLARSAT™: July takes a breather (down 15% from Q2 average)

After a big June and Q2, new utility solar construction took a breather in July posting only ~2.5 GWac compared to ~3 GWac per month since April.
ENPH volumes up, but broader market still languishing

We are revising down our 2024E projection to -25%, the first notable revision since we published -18% in September 2023.
Updating Q2 model / database (2024E unchanged); Tracker backlog @ 9 GWac; Texas grid 10% solar this summer

In this note, we are updating our utility solar database and pipeline.
SOLARSAT™: Record Q2 new construction starts (9.3 GWac); Top 30 finally ramping; Tracker installs flat y/y

During the month, another 16 projects have kicked off, shrugging off potential AD/CVD tariffs and contrary to the solar construction delay narrative.
Expected rebound NOT materializing; May permits still down 35% y/y (Cali down 60%)
The much anticipated rebound in residential solar activity is not yet happening, according to our recent permit data.
SOLARSAT™: Another 18 big projects (3 GWac) kicked off in May; Trackers on pace for flattish y/y; SEIA estimates way too low

Despite SEIA claims of a slowdown, persistent delay anecdotes, and tariff fears, actual new solar construction has remained firm.
Pipeline update – new approvals down again; Late stage queue flat at 112 GWac

In this note, we are updating our utility solar database and pipeline.
SOLARSAT™: New construction – no problem; Nextera overweight; Trackers flat; Shoals losing share

U.S. utility-scale solar market is having no problem starting projects.
AD/CVD pockets of risk, but mostly exaggerated

In this note, we summarize our recent data collected surrounding U.S. solar module imports and solar demand as it relates to AD/CVD risk.