
BATTERY STORAGE NOTE TO CLIENTS 052026
In this note we highlight takeaways from our latest battery storage update… New construction starts for utility scale battery storage jumped to a record… CAISO, MISO, and PJM were the standouts this quarter…
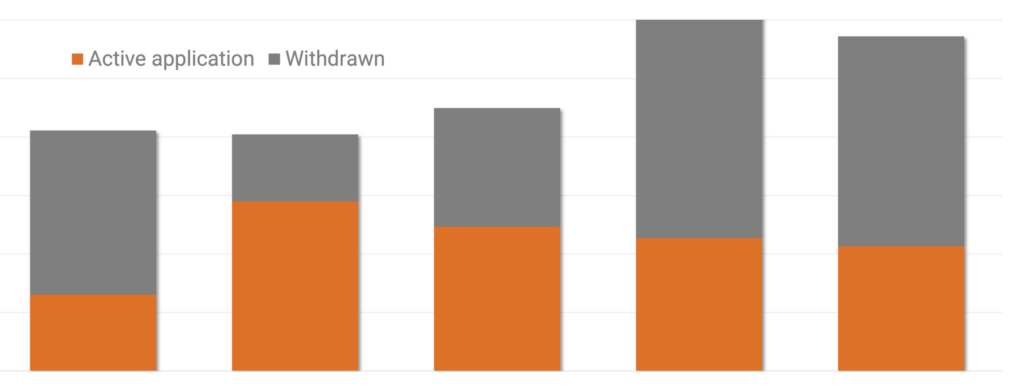
2025 modest construction growth (+7%); Growth reaccelerating this year (CA, Northwest, Georgia); PRIM boost last year, MTZ on deck
Construction activity for large scale FTM battery storage increased modestly to… GW in 2025… We are projecting battery storage construction growth to reaccelerate into the… per year range in 2026/2027
BESS construction firm Q3; double digit growth through 2027; ERCOT red flags; Tesla big share gains
In this note, we are updating our BESS data for the latest construction and approval data.
OBBB driven construction surge (record 7 GW started); Offsetting data center demand; PJM too little too late

In this note, we are updating our utility-scale battery storage data, which includes a recent surge in construction and development activity.
Data trends firm dispite anecdotes; Record 15 GW approved / 6 GW started in Q1; California doing better
In this report, we are updating our utility battery storage data for Q1’25.
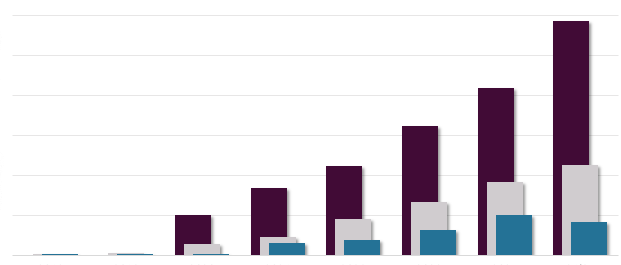
Pipeline steps up to 71 GW; Texas still @ top (AZ #2); New construction +10-20% 2025E (vs 35% last year); Beware of EIA data

In this report, we are updating our historical battery storage data for Q4’24 and publishing new forecasts for 2025E / 2026E. Broadly speaking, the storage market remains on firm footing, with growth continuing into this year
Another 4GW new construction starts (on track for 30% growth this year); Texas almost half; FLNC, TSLA, CSI share gains
With three quarters in the books, the U.S. utility scale storage market is on track to land +30% this year, not too far off from original expectations and better than most other renewable sectors.
New activity humming; Pipeline growing; FLNC/TSLA share gains; Raising our battery storage projections

In this note, we are updating our large scale battery storage data (ES-1, ES-3, ES-3.1, ES-3.2) after processing 2Q new construction starts, interconnections, and market share.
Momentum continues; Record new construction starts; FLNC+TSLA share gains

In this note we are updating our quarterly large scale battery storage (BESS) data.
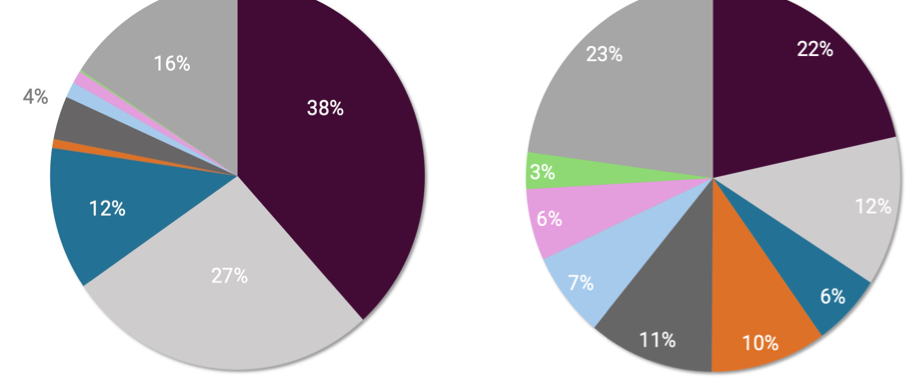
25 developers that will build 70% of capacity; FLNC has 5 of them; AES big jump this year; New developer / integrator matrix
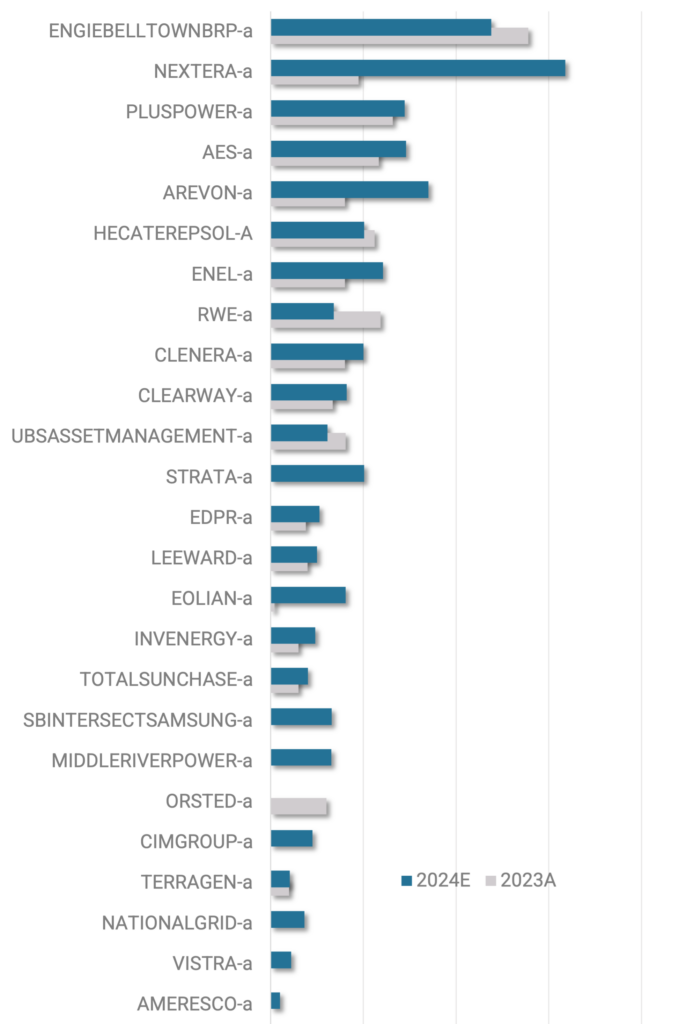
In this note, we break out our battery storage data, highlighting the 25 largest developers that will make up 70% of the utility-scale market in 2024.