
SOLARSAT™: June construction bounces after May dip

After a dip in May… June new solar construction bounced back… new construction back inline with our original forecast of…
Takeaways from our new monthly U.S. Solar Crew Count

To add transparency to the U.S. utility-scale solar industry, we are now publishing a new monthly Solar Crew Count… This will be a bottom up count of all locations (>50 MWac) actively deploying labor and resources for solar construction and installation…
SOLARSAT™: New construction takes breather in May (worst month of 2025)…while tracker installs pick up pace

After a very strong start to 2025… new utility scale solar construction starts were oddly quiet in May… the lowest by far this year – and during a month that is historically one of the strongest…
Approvals post another firm quarter (proxy for orders); PJM heavy momentum; Phoenix takeaways

As of May, we now count… utility scale solar projects in the late stage pipeline… Since stalling… in early 2024, the pipeline has been on a steady trend upward.
SOLARSAT™: April confirms upward trajectory; Revising estimates higher; Trackers likely up 15-20%
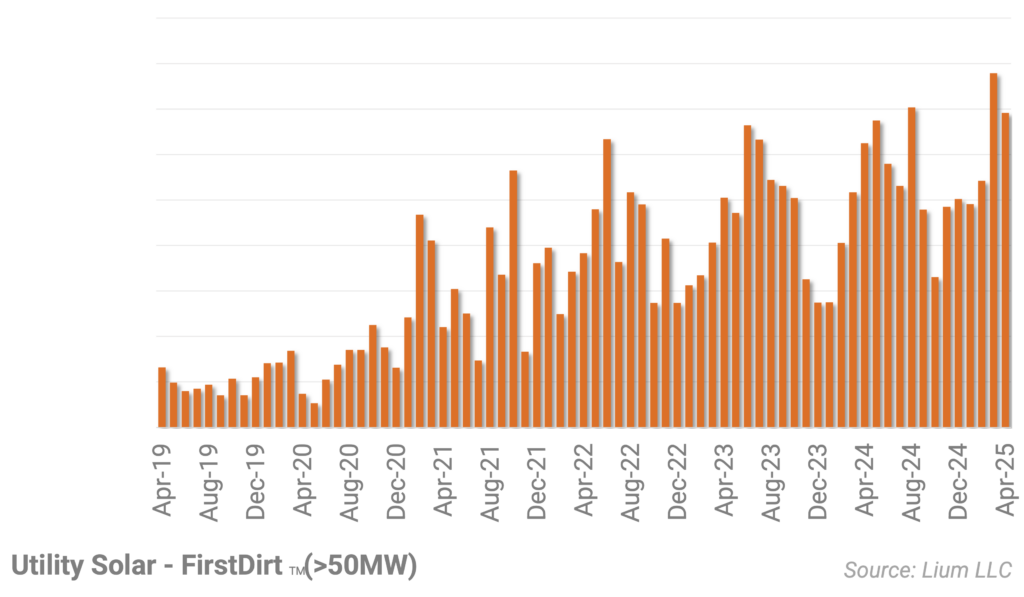
April saw another strong month for utility-scale solar starts with… continuing the pace set in March… The largest project to move dirt this month was Hanson Solar (396MW) in Texas…
Updating project level details (LS-2) and forecasts (LS-1)

In this note we summarize the changes we have made to our project level details (LS-2) and 2025E / 2026E forecasts (LS-1)…
SOLARSAT™: March wraps up very active Q1

March new solar construction showed no signs of slowing… In fact, an additional… projects kicked off construction last month… capping off a huge Q1.
SOLARSAT™: Clear inflection (Q1 new starts will jump 20%+ Y/Y); 2025 forecast likely too low

After running February satellite data… we are seeing a clear inflection in the level of new construction starts for utility-scale solar…
Pipeline firm to start 2025 (another 15 GWac approved); PJM huge driver….others ho-hum

Below we list takeaways after updating our utility scale solar database (LS-2 and PLUS-201).
SOLARSAT™: Construction off to quick start (Jan firstDIRT ~3 GWac)

During January, we identified… utility-scale solar projects that kicked off site work during the month… This compares to the last three Januarys that averaged… and during a seasonally slow time of year…