

AD/CVD pockets of risk, but mostly exaggerated
In this note, we summarize our recent data collected surrounding U.S. solar module imports and solar...
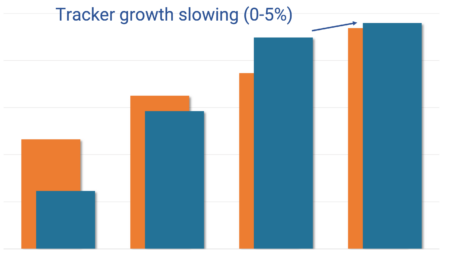
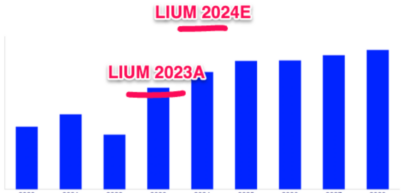
Lowering 2024E tracker forecast (now +0-5%); New construction starts on schedule
After seeing the pace of 1Q starts, collecting new permits / interconnections agreements, and reassessing our...
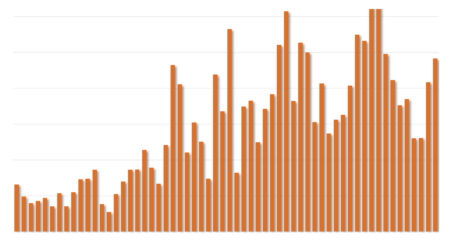
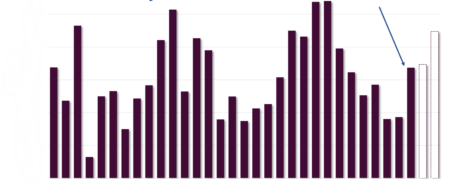
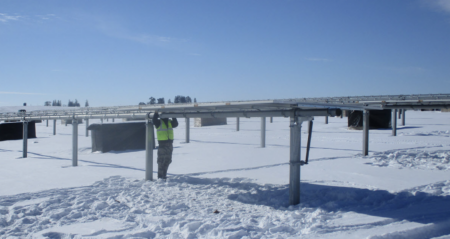
SOLARSAT™: Seasonal uptick continues w/ March new construction @ 2.4 GWac (+15% y/y); Mostly Nextera, others flat; Tracker installations disappoint
Generally speaking, the seasonal uptick is happening with March noticeably higher for both new construction starts...
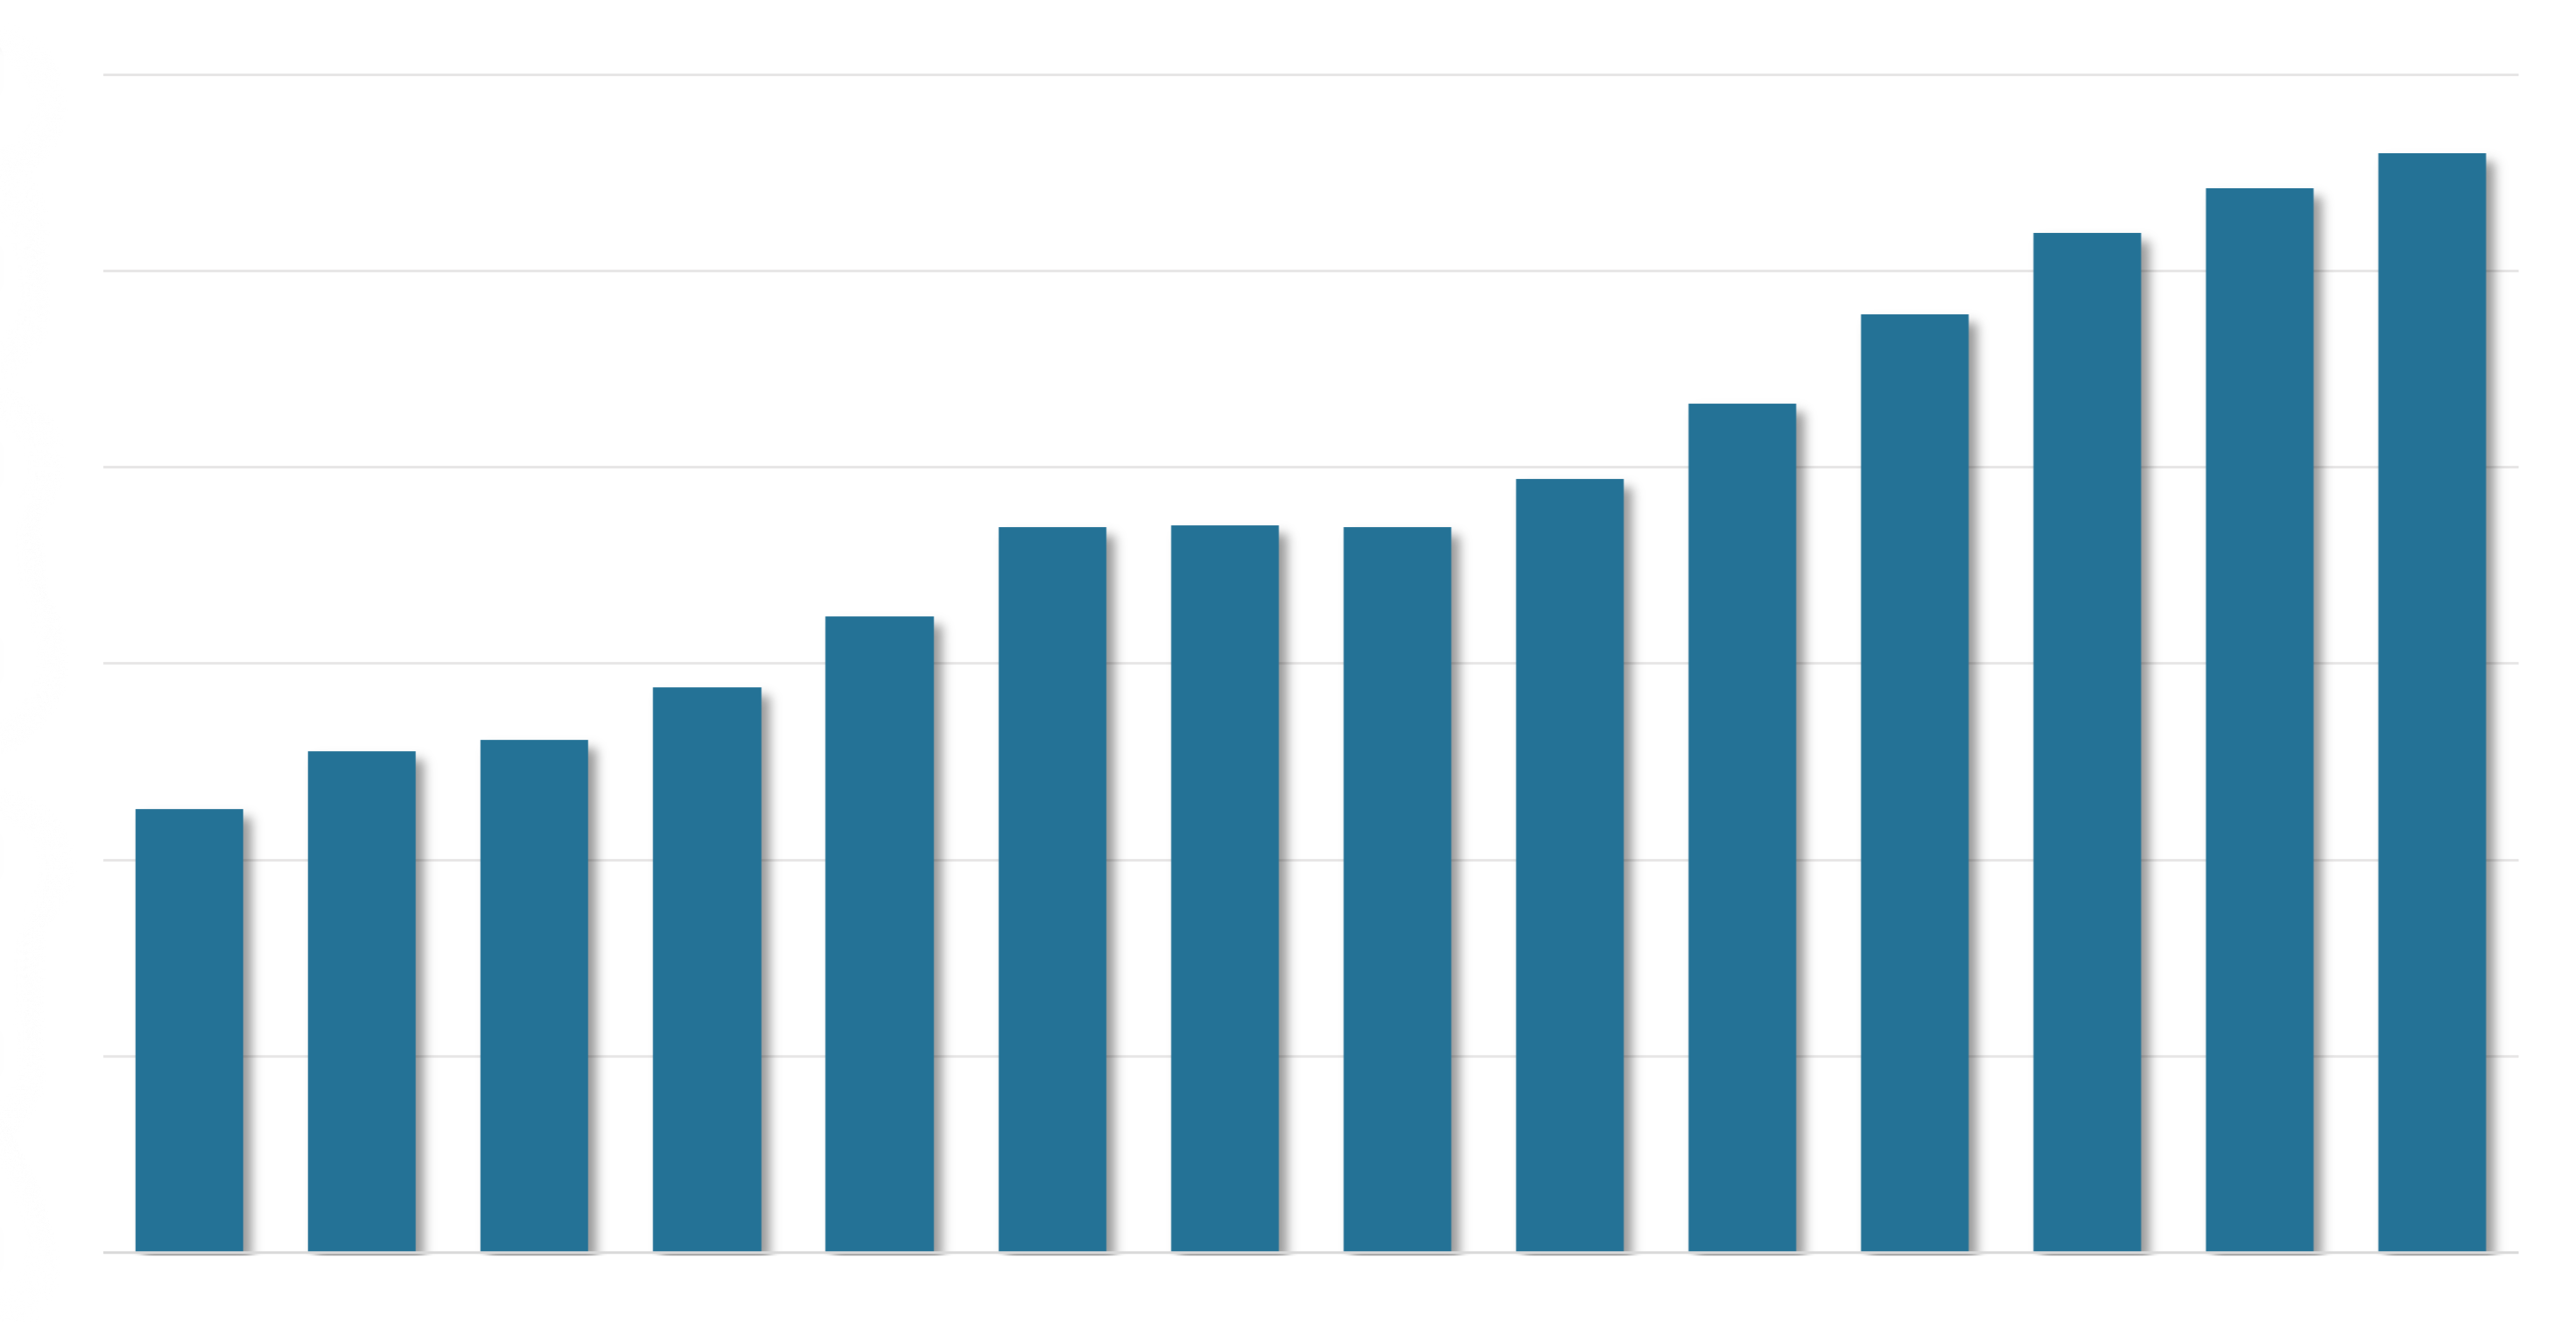
Late Stage Pipeline Update – up again, but growth slowing (only ~10 GWac contracts signed last 3 months vs 60 GWac in 2023)
Broadly speaking, the utility scale solar pipeline continued to grow in Q1’24, hitting 112 GWac of...
SOLARSAT™: February new construction bounce
Although more than a few companies continue to stress widespread delays, we have not yet seen...
SOLARSAT™: Modest start to 2024
In this note we summarize U.S. utility solar activity from January

U.S. Manufacturing Study (production is ramping); +20 GWdc realistic by June 50-60 GWdc by 2025
In this study we have updated our U.S. solar module manufacturing data, focusing on facilities that...
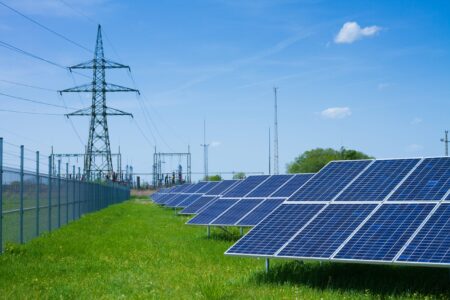
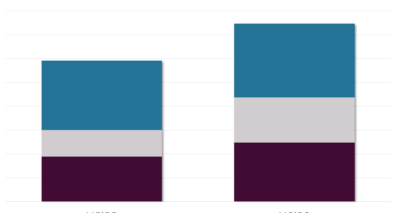
Final 2023 interconnections (17.6 GWac – up 60% y/y); 2024 will surge again
This week, the EIA released final December and 2023 interconnection data, highlighting 5.6 GWac turned on in...
SOLARSAT™: Activity still chugging along nicely
Generally speaking, activity has continued to chug along in recent months despite fears from some public...
2024 Outlook – Interconnections surge again (50% above Woodmac estimates); New construction +15-20%
In this note, we are updating our utility solar model (LS-1), highlighting forecasts for interconnections, new...