
UTILITY SOLAR NOTE TO CLIENTS 072726
In this note, we are updating our utility-scale solar data and forecasts... latest trends in construction starts,...

SOLARSAT™ NOTE TO CLIENTS 071026
In this note, we refresh our monthly satellite and on-the-ground datasets, with June updated for FirstDirt,...
SOLARSAT™ NOTE TO CLIENTS 061026
In this note, we refresh our monthly satellite and on-the-ground datasets, with May updated for FirstDirt,...
UTILITY SOLAR NOTE TO CLIENTS 060126
In this note, we update our Q2 solar development data, paying closest attention to 1) new...

SOLARSAT™: April new starts light @ 2.8 GW (lots of projects, but all small); Midwest ramp begins; crews jump
In this note, we refresh our monthly satellite and on-the-ground datasets, with April updated for FirstDirt,...
Data refresh (Q1 / 2026); Construction on track; Module install ramp; New applications still main concern
In this note, we are updating our utility solar quarterly data and forecasts to reflect the...
SOLARSAT™: Record March (4.5 GW New Site Work); Nextracker & SOLV share gains
In this note, we refresh our monthly satellite and on-the-ground datasets, with March updated for FirstDirt,...
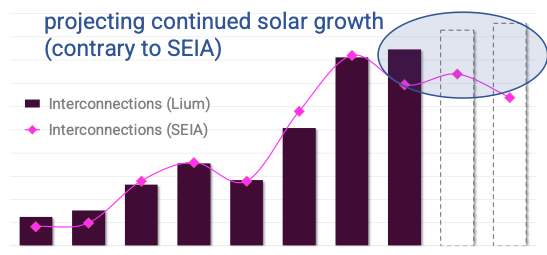
SOLARSAT™: EIA 860M (SEIA) is broken, ignore it; 2026 grows 10+% (albeit ho-hum start w/ low tracker installs); Nextera adds new Mortenson work
In this note, we refresh our monthly satellite and on-the-ground datasets, with February updated for FirstDirt,...
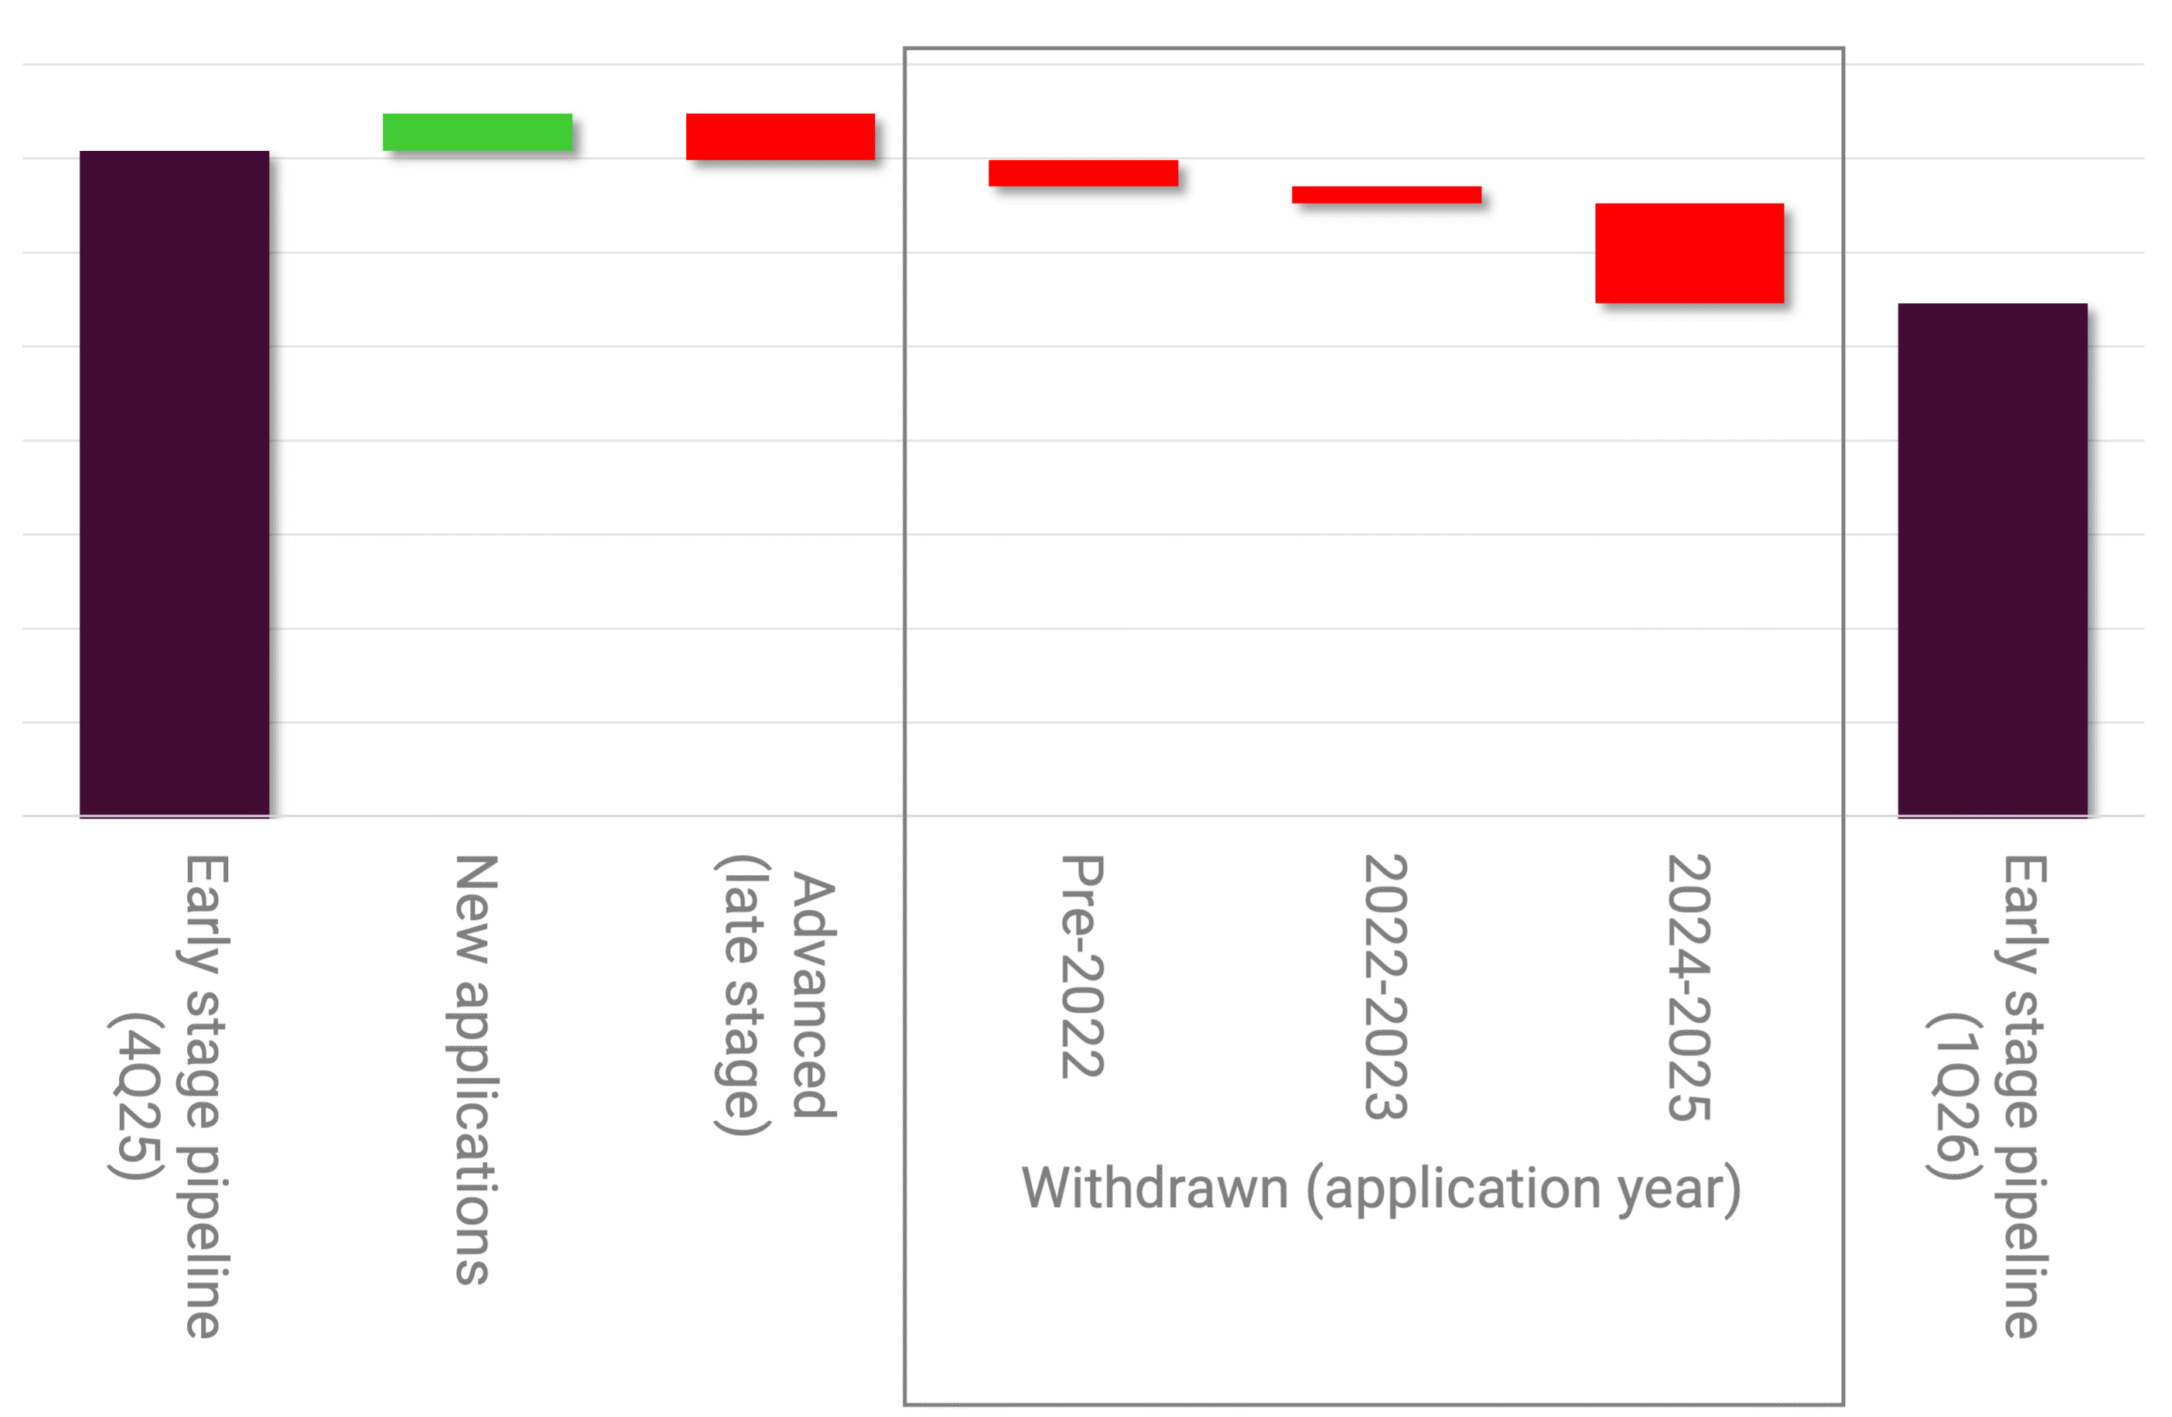
Approvals inflect higher (25 GW this qtr); Visibility through 2027E; But new applications have dried up
In this note, we summarize our takeaways after processing the last three months of applications, permits,...
SOLARSAT™: Slow construction start (lot of bad weather); Solar crews drop 12 to 208; Solv starts massive Swenson project; Gamechange taking share
In this note, we provide an update on construction activity since the beginning of the year......