
SOLARSAT™: Panels on full tilt (9 GW installed last 3 months); Solar crew efficiency up 5-10% this year; FirstDIRT firm
Solar crew count was flat again at ~230 in November compared to October. Compared to last year, the crew count is up 15%, driven by crew adds in Arizona, California, and Louisiana.
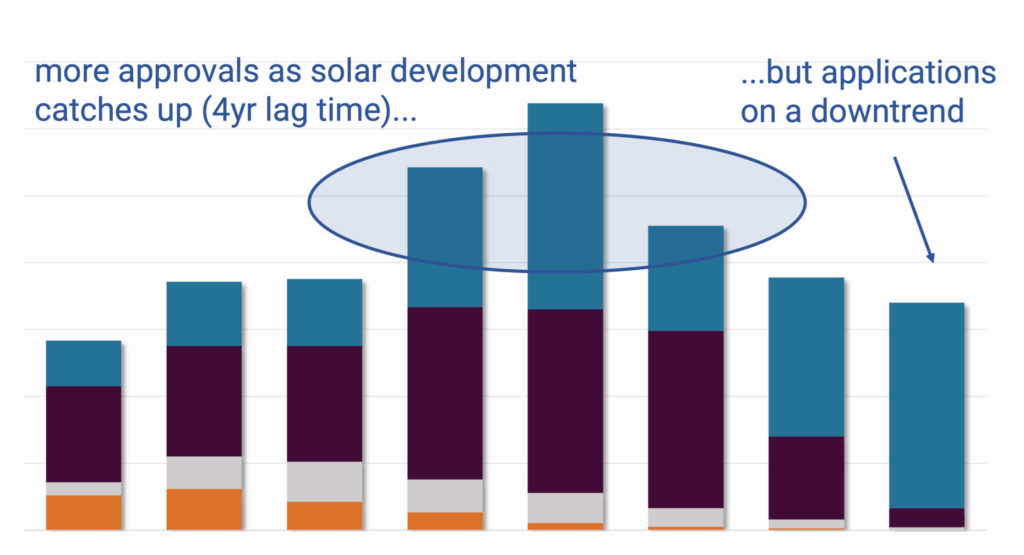
Solar train is rolling (RECORD 18 GW approved this quarter); Increasing 2027E construction projections; Applications on a downtrend
In this note, we summarize our utility-scale solar data after processing the last 3-months of construction, approval, and application filings….
SOLARSAT™: Construction momentum remains firm (October +25% y/y); Arizona big month

October utility scale solar projects started construction… very firm for this time of year, tracking up… Solar crew count was flat… EPC crews in California have been the standout…
Increasing 2026E projections (+10-15% y/y); Implies 50-60 more crews needed; Market share adds (Nextracker, Mastec, First Solar)

In this note, we are updating our utility-scale solar model (LS-1) which includes 2026E / 2027E projections for construction, solar crews, trackers and interconnections…
SOLARSAT™: Q3 wraps on high note (tracker installs +20% y/y); Crew efficiency-big gains driven by big EPCs; 2026E thoughts

In this note we 1) update our September construction activity 2) provide color on the latest EPC crew efficiency data and 3) take a glance at 2026E.
SOLARSAT™: Not yet seeing post-OBBB construction surge; Surprisingly SLOW TEXAS – driven by a MAJOR problem; PJM solar FINALLY taking flight
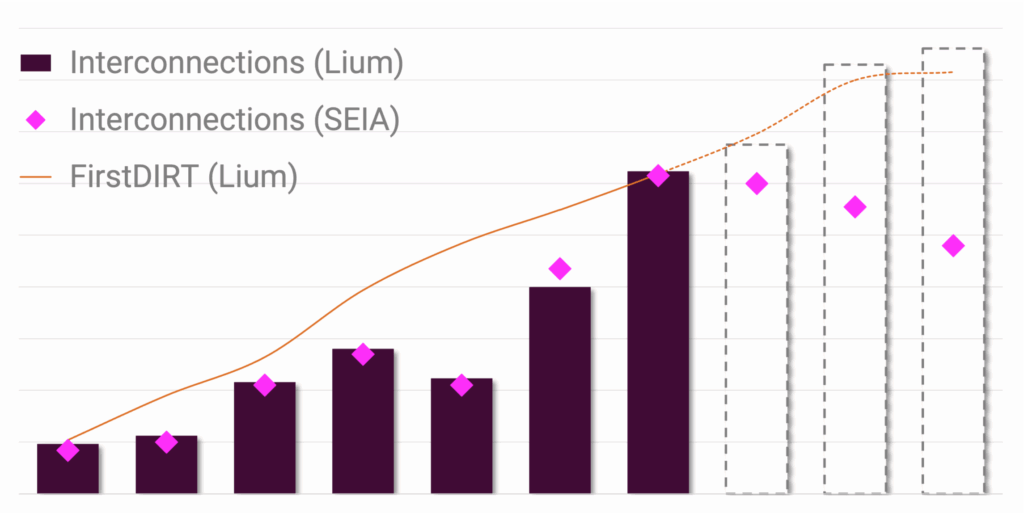
Contrary to the SEIA / Woodmac report this week… we are anticipating a big boost to solar installations (interconnections) through 2028E…
New solar applications on track for >200 GWac in 2025…50 GWac will receive construction approval

The latest data is supportive of our view that utility scale solar construction and interconnections will be better than expected over the next several years…
SOLARSAT™: July construction inline; On track for 8.5 GWac in Q3 (YTD +15%)

Below see key takeaways after reviewing utility-scale solar construction activity for July 2025.
SOLARSAT™: June construction bounces after May dip
After a dip in May… June new solar construction bounced back… new construction back inline with our original forecast of…
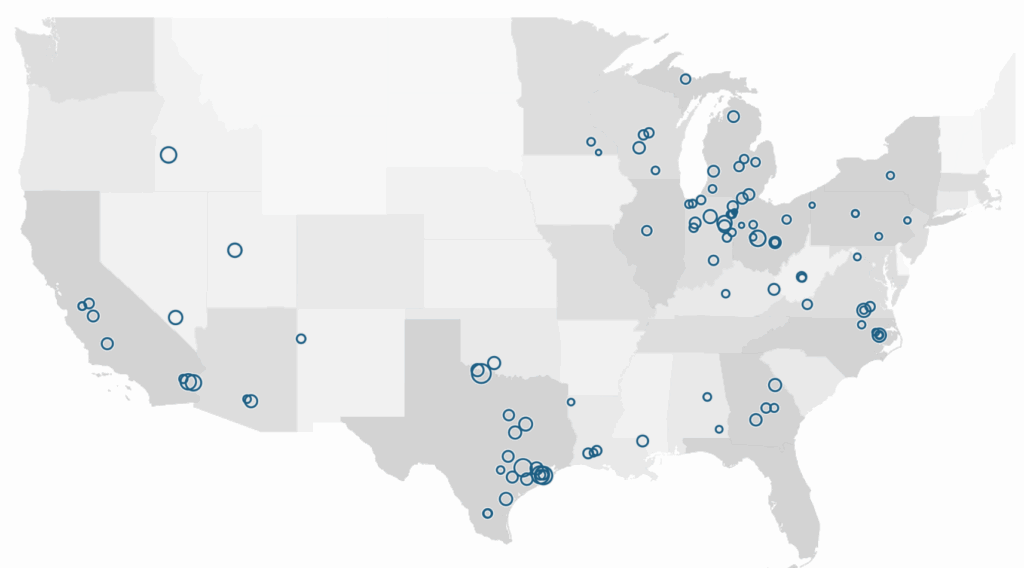
Takeaways from our new monthly U.S. Solar Crew Count

To add transparency to the U.S. utility-scale solar industry, we are now publishing a new monthly Solar Crew Count… This will be a bottom up count of all locations (>50 MWac) actively deploying labor and resources for solar construction and installation…