
August still trending lower
For August, residential solar permits are landing down 18% y/y.
First look at California interconnection applications (Q2 finally released this week)
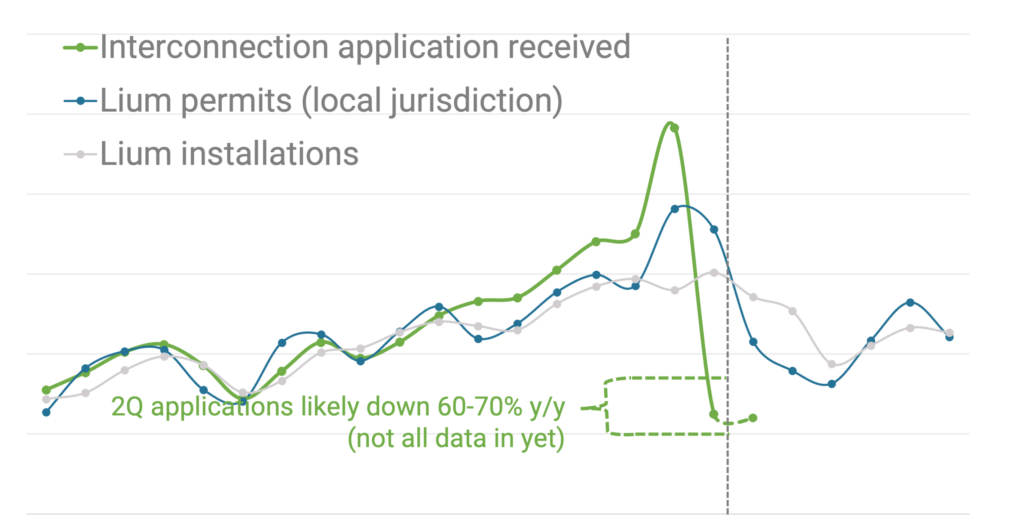
California interconnection application data was finally released following the NEM 3.0 switch, confirming a >60% y/y drop in applications in Q2.
July not bouncing back; Estimates still too high
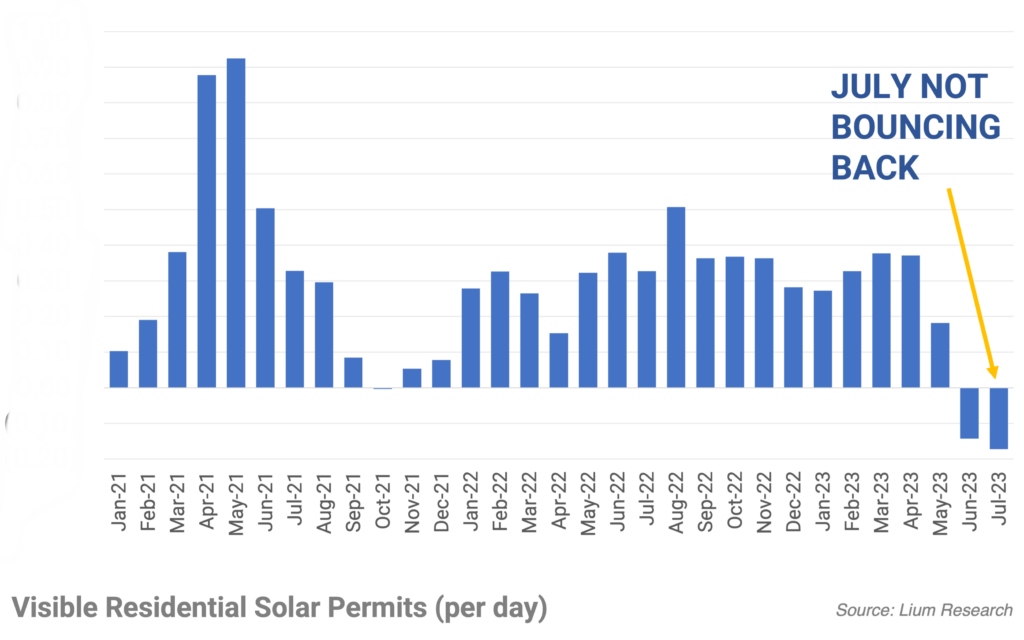
Last weeks permit activity was another disappointing datapoint, with residential solar permits down 18% y/y.
Terrible June followed by even slower July 4 last week
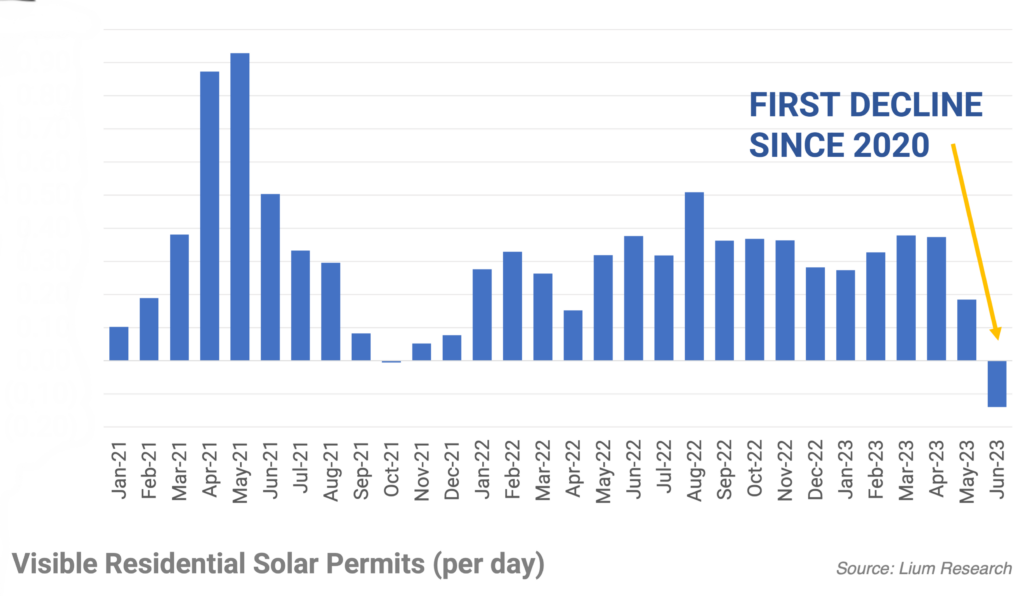
June rooftop permits declined compared to May for the first time since 2020 and landed down 15% y/y. July has started off even worse, with the July 4 week down 20% compared to the same week a year ago.
Updating Q2 data and full year estimates

With a summer ramp looking much more subdued than last year, we are anticipating H2’23E permits to decline 10-15% from H2’22.
May still clinging to up y/y (June will not be)

According to our data, May U.S. residential permits declined 7% from April but still clinging to up 15% compared to last year.
Import flows still good, but decelerating
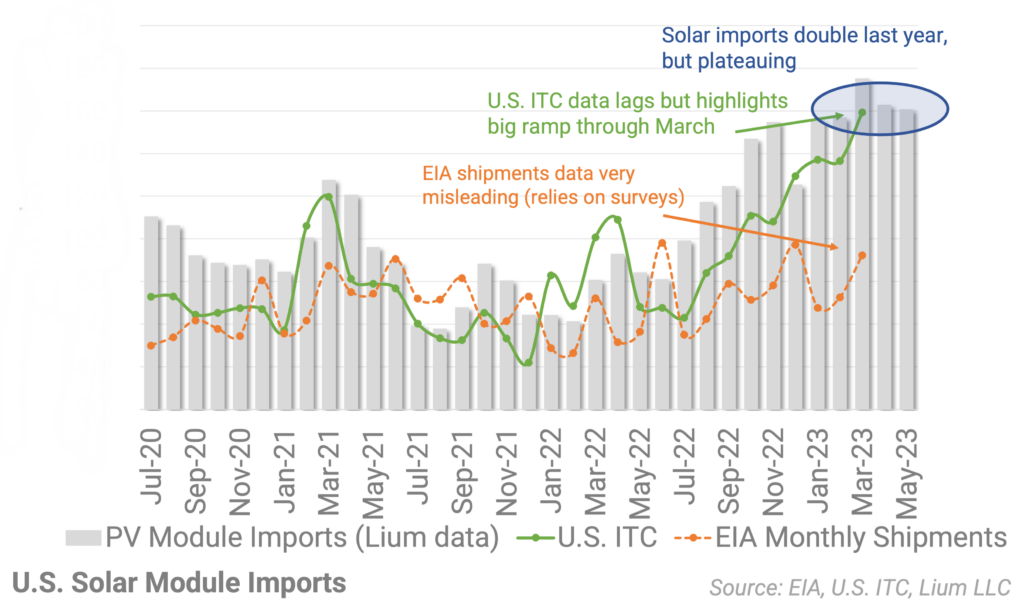
The U.S. imported roughly double the volume of solar modules in April and early May compared to a year ago.
NEM 3 (Week 4) – Still holding up better than expected
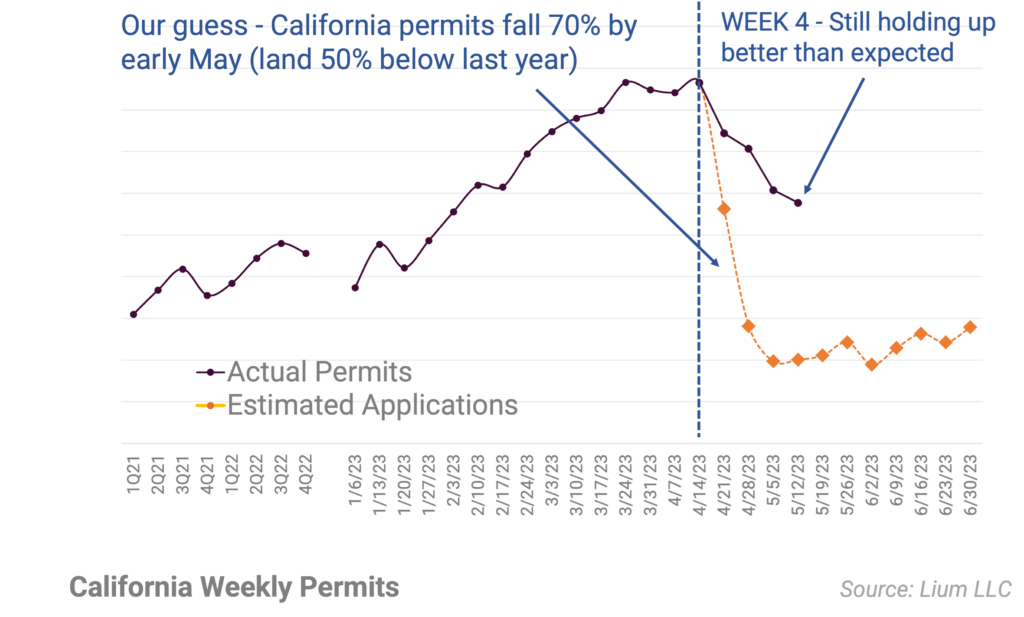
Since April 14, permit activity in cities switching to California NEM 3.0 have declined by roughly 35% peak-to-trough.
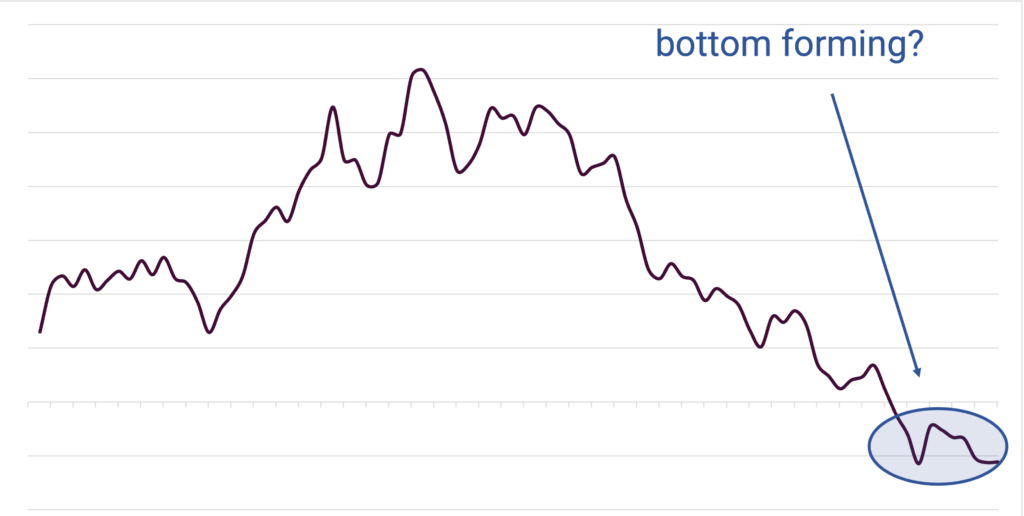
NEM 3 (Week 3) – Searching for bottom
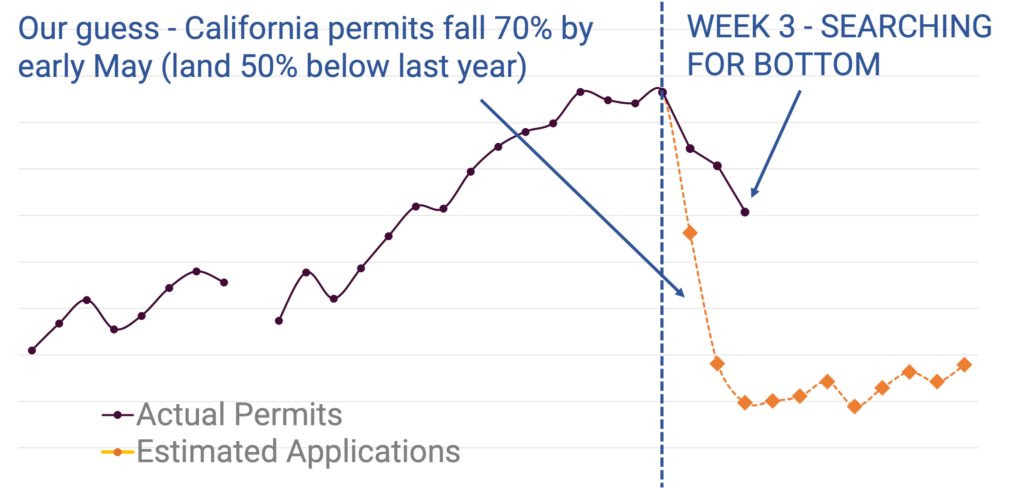
For the week ended May 5th, California residential solar permits declined by another 13% and are now tracking down more than ~30% since the onset of NEM 3.0.
NEM 3 (Week 2) – Steady decline but not a free fall
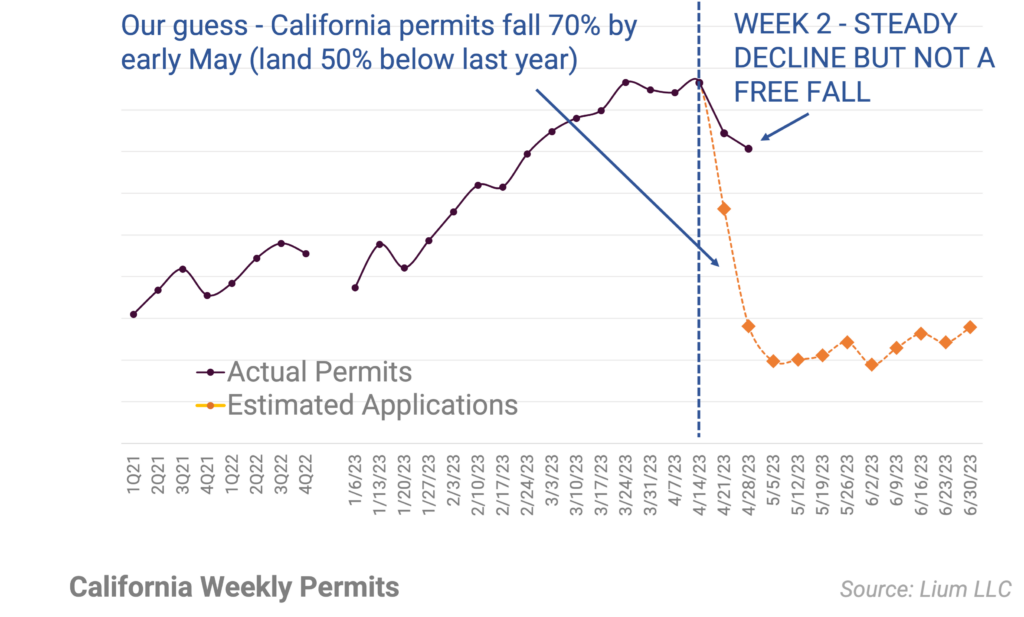
While the full force of NEM 3.0 has yet to hit local data, the less dramatic decline so far suggests installations could be better than expected over the next 3-9 months.