

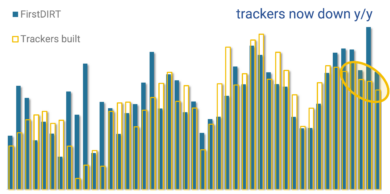
SOLARSAT™: Oct solar construction of soft side (<2GW); 85% new activity in Trump states; Trackers on pace for down 5-10% y/y
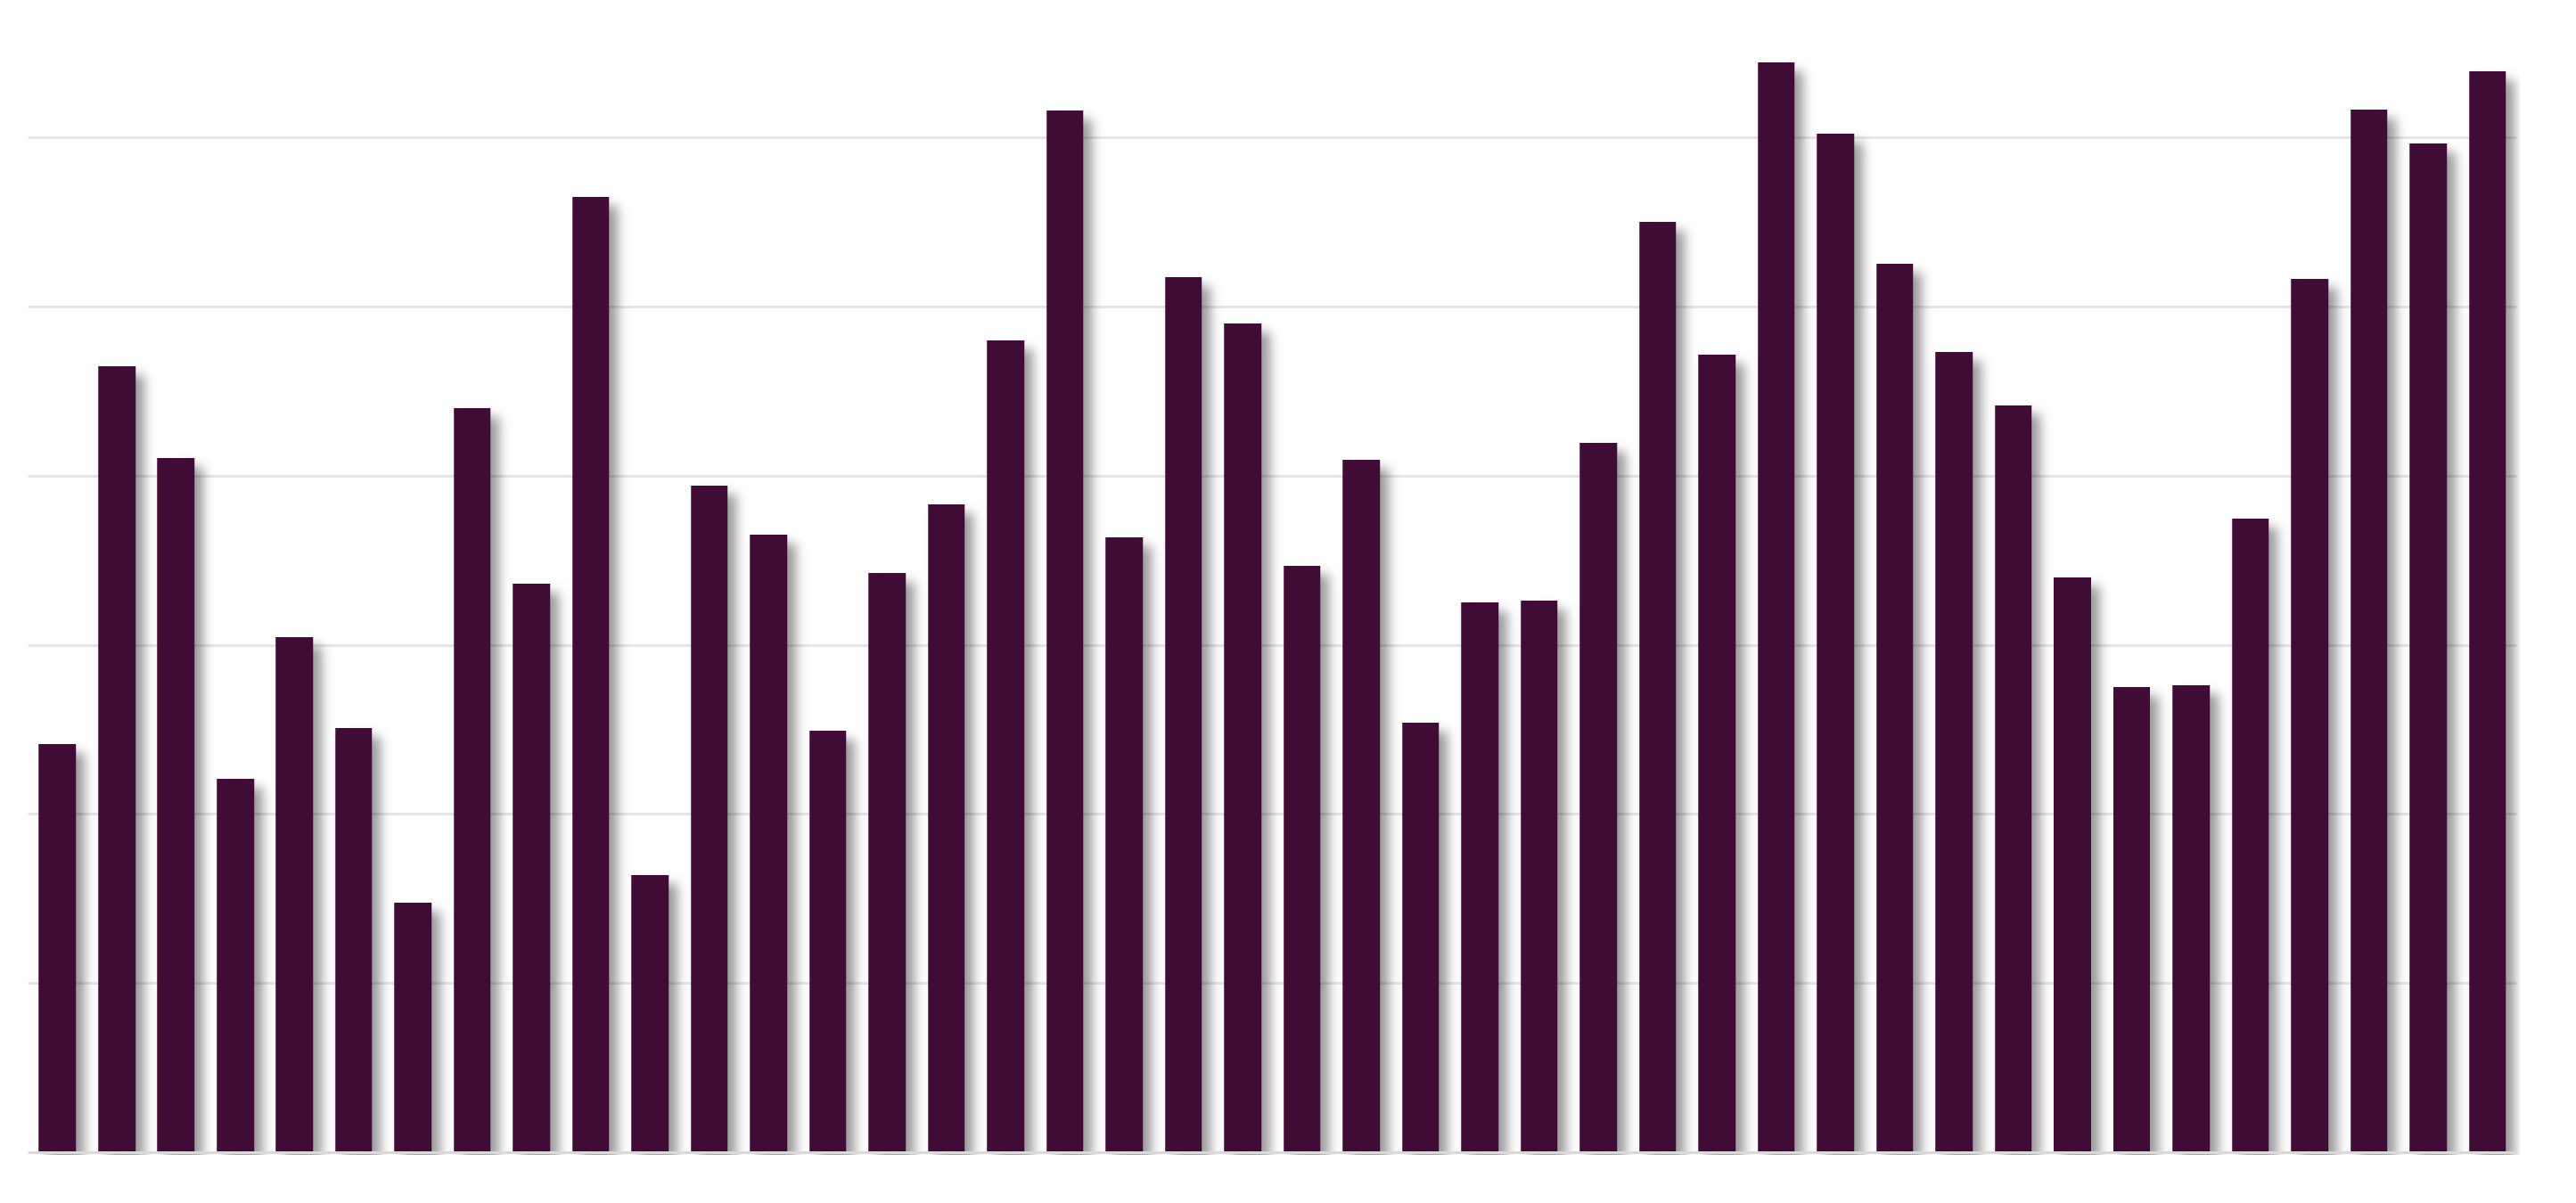
Little less than 2 GWac of new projects kicked off during October
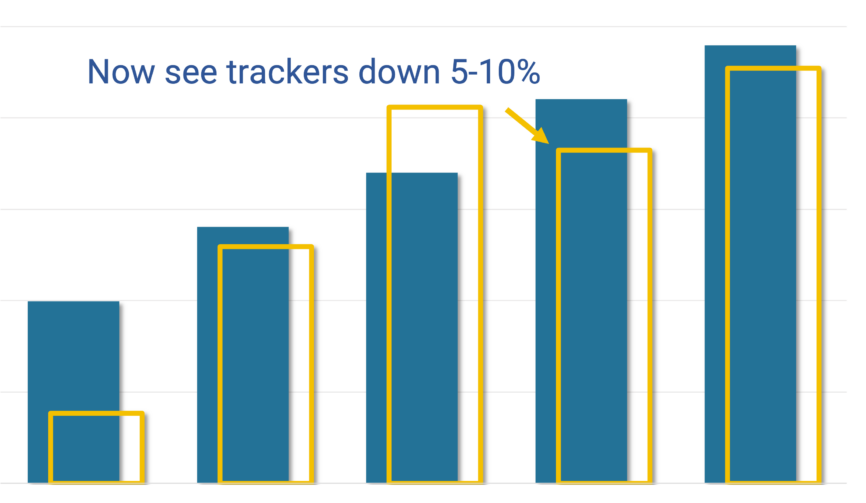
Model update…2024 trackers DOWN 5-10% (new construction +15%); 2025E signs of +10-20%
In this note, we are updating our 2024/2025 Utility Scale Solar Model (LS-1) after putting in...
SOLARSAT™: September new starts firm again (2.6 GWac); Q3 lands +12% y/y; Tracker installs soft
After a record August, September new construction has remained firm. Specifically, 2.6 GWac of new projects...

Refreshing data sheets to reflect latest construction starts (LS-2, PLUS-201); 2025E tracker outlook improving
In this note, we are updating our LS-2 and PLUS-201 files to reflect the latest satellite...

SOLARSAT™: Huge August for new construction starts (3Q tracking +20% y/y)
After a disappointing July, new construction starts have seen a huge bounce in August. In fact,...

Deeper Dive To Understand Project Delays
As a broad takeaway, delays in project developments are slightly more elevated now, but NOT significantly...
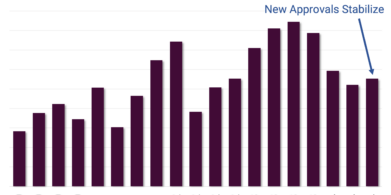
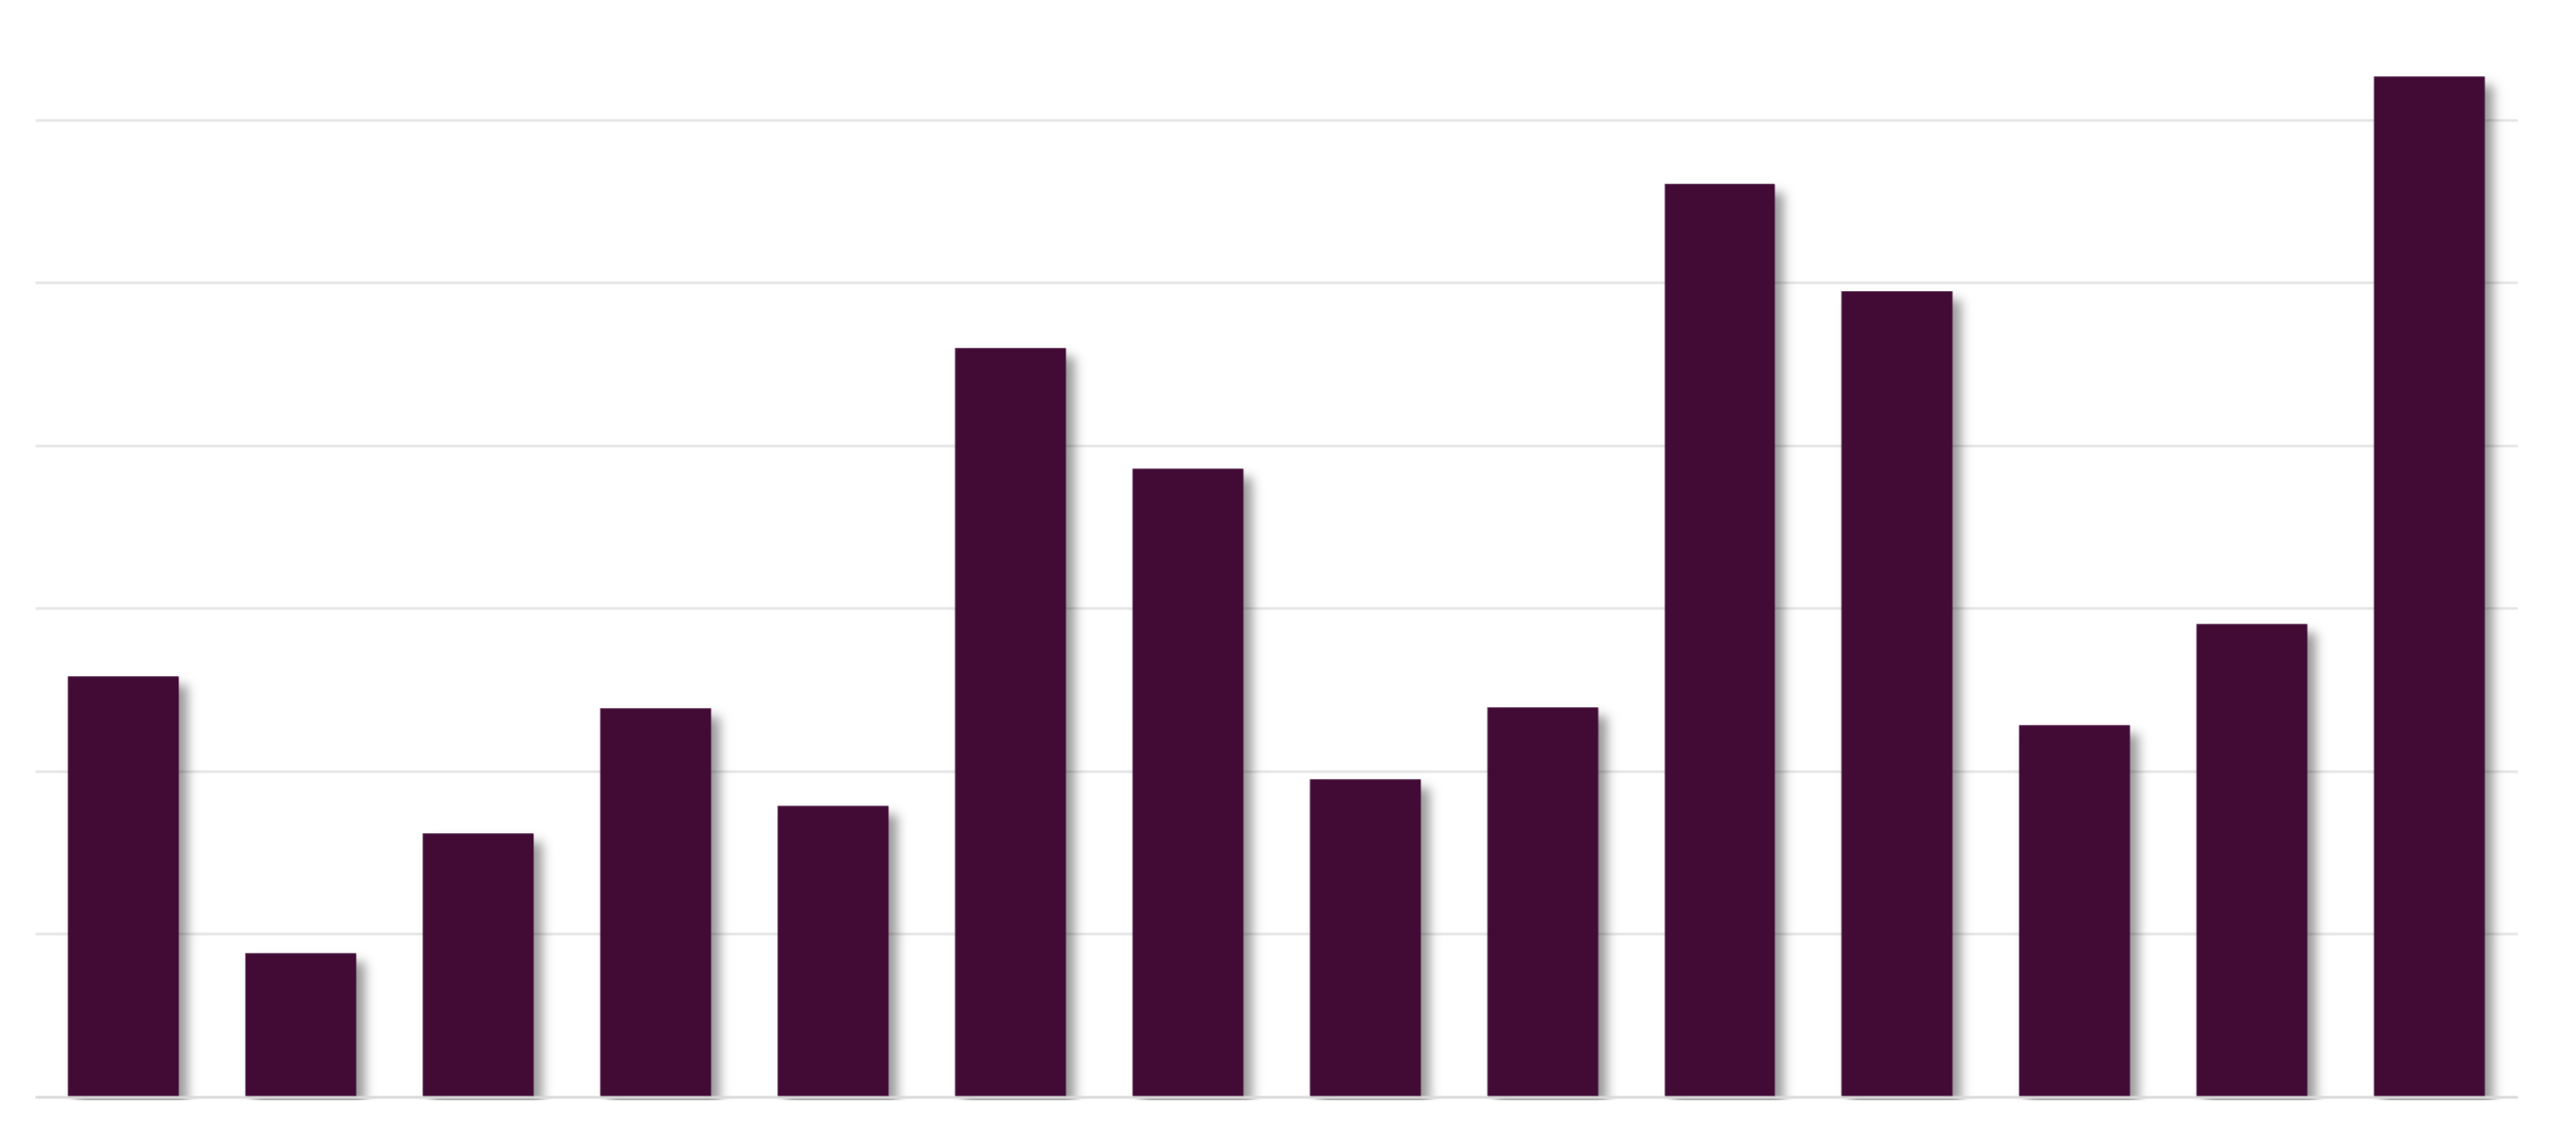
Pipeline update (approvals get support after 3 down qtrs); TX strong as ever; CAISO/PJM terrible
In this update, we have processed the new interconnection approvals that have been executed over the...

SOLARSAT™: July takes a breather (down 15% from Q2 average)
After a big June and Q2, new utility solar construction took a breather in July posting...
Updating Q2 model / database (2024E unchanged); Tracker backlog @ 9 GWac; Texas grid 10% solar this summer
In this note, we are updating our utility solar database and pipeline.
SOLARSAT™: Record Q2 new construction starts (9.3 GWac); Top 30 finally ramping; Tracker installs flat y/y
During the month, another 16 projects have kicked off, shrugging off potential AD/CVD tariffs and contrary...